

Bitcoin Weekly RSI Points To More Upside, But Can the Bulls Defend $107,000?

Source Newsbtc

Bitcoin’s weekly chart shows promising signs of strength as the RSI continues to climb, hinting at the potential for further upside. However, the battle isn’t over yet. With price hovering near the critical $107,000 support, bulls must defend this level to prevent deeper downside pressure.

RSI And Price Alignment: A Textbook Case Of Momentum Confirmation

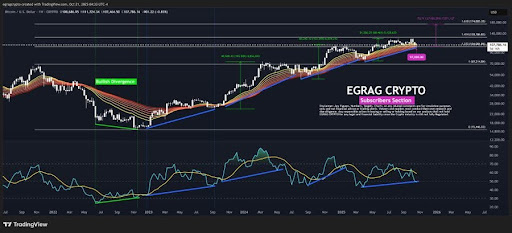
In a recent market update, EGRAG CRYPTO questioned whether the bulls and bears are even analyzing the same chart, as the current macro weekly structure of Bitcoin shows no signs of bearishness. The broader setup remains firmly bullish, suggesting that the ongoing price movements are part of a healthy uptrend.

The analyst emphasized that when Bitcoin’s price and the Relative Strength Index (RSI) rise simultaneously on the weekly timeframe, it serves as a confirmation of momentum rather than a warning sign. This alignment often signals strong buying interest and market conviction, supporting the argument for continued bullish pressure in the near to mid-term.
Bitcoin

EGRAG CRYPTO further highlighted that the Exponential Moving Average (EMA) ribbon remains supportive, reinforcing the trend’s strength. In the expert’s view, the current setup is a clear indication of macro confirmation, not mere market noise. Such alignment between indicators typically precedes significant continuation phases, showing that the trend remains well-structured and sustainable.

However, the expert added a note of caution, stating that traders should only be wary if the RSI climbs into overbought territory above 70, which could suggest a temporary cooldown. For now, with RSI hovering around 50, Bitcoin still has plenty of room to run. This leaves the market with a strong technical foundation and considerable potential for further upside momentum.

Bitcoin Faces Rejection At $111,000: Bulls Lose Grip On Momentum

According to Crypto VIP Signal’s latest analysis, Bitcoin is currently facing challenges after failing to sustain its upward momentum above $111,000. The rejection from this point suggests that selling pressure remains strong, keeping bullish momentum temporarily in check.

Crypto VIP explained that Bitcoin is now retesting the $107,000 support zone, a critical area that could determine the next possible move. Holding this level is essential to prevent a deeper pullback, as it has served as a key foundation during previous consolidation phases.

However, a decisive break below the $107,000 support would likely trigger additional selling pressure, potentially extending the ongoing correction. Monitoring this level closely now appears important, since a bounce from here could reignite bullish sentiment, while a breakdown might expose Bitcoin to further downside risks in the short term.

Bitcoin
Disclaimer: For information purposes only. Past performance is not indicative of future results.
placeholder
Fed hike odds near 90% into Wednesday's decision — how to trade the dollar, gold and the S&P 500A 0.3% monthly core CPI print has lifted the market-implied probability of a 25bp Fed hike on 16 September to roughly 86.5% ~ 90%, which would be the first increase since July 2023. Here is the decision timeline, the pricing versus the forecasts, both scenarios, and the key levels for the dollar, gold and the S&P 500.
Author  Suzie
Sep 14, Mon
A 0.3% monthly core CPI print has lifted the market-implied probability of a 25bp Fed hike on 16 September to roughly 86.5% ~ 90%, which would be the first increase since July 2023. Here is the decision timeline, the pricing versus the forecasts, both scenarios, and the key levels for the dollar, gold and the S&P 500.
placeholder
Silver breaks $64 as precious metals rebound — can gold hold the $4,280 line into the Fed decision?Silver has climbed back above $64 an ounce for the first time this week, leading a broad rebound across precious metals hours before the Federal Reserve delivers what is expected to be its first rate hike since 2023. Spot silver was last at $64.64, up 1.49% on the day, while gold reclaimed $4,300 and platinum and palladium both advanced. The question now is whether the bounce is a genuine turn — or a pause before the Fed's dot plot decides the next move.
Author  Suzie
Sep 16, Wed
Silver has climbed back above $64 an ounce for the first time this week, leading a broad rebound across precious metals hours before the Federal Reserve delivers what is expected to be its first rate hike since 2023. Spot silver was last at $64.64, up 1.49% on the day, while gold reclaimed $4,300 and platinum and palladium both advanced. The question now is whether the bounce is a genuine turn — or a pause before the Fed's dot plot decides the next move.
placeholder
Bitcoin falls below $75,000 as the CLARITY Act fails in the Senate — what the vote means for cryptoThe US Senate blocked the Digital Asset Market CLARITY Act in a 49-50 procedural vote, sending Bitcoin briefly below $75,000 — its biggest one-day drop since June. Ethereum fell more than 8%, Coinbase slid 10% and $75 billion of crypto market value evaporated. Here is what the vote was, why it failed, and the levels that matter now.
Author  Suzie
Sep 16, Wed
The US Senate blocked the Digital Asset Market CLARITY Act in a 49-50 procedural vote, sending Bitcoin briefly below $75,000 — its biggest one-day drop since June. Ethereum fell more than 8%, Coinbase slid 10% and $75 billion of crypto market value evaporated. Here is what the vote was, why it failed, and the levels that matter now.
placeholder
Dow drops 631 points as the Fed hikes — but futures are rebounding: what's next for US stocks?The Dow fell 631 points and the S&P 500 closed below 7,600 after the Fed hiked rates for the first time since 2023, with the dot plot showing 16 of 18 officials expect more tightening. Asia-session futures are already recovering — here are the levels and analyst views that decide whether 7,500 holds.
Author  Irene Q.
Yesterday 02: 54
The Dow fell 631 points and the S&P 500 closed below 7,600 after the Fed hiked rates for the first time since 2023, with the dot plot showing 16 of 18 officials expect more tightening. Asia-session futures are already recovering — here are the levels and analyst views that decide whether 7,500 holds.
placeholder
Dollar index tops 100 for the first time since July as the Fed's hawkish dot plot sinks inThe U.S. dollar index broke back above 100 for the first time since 31 July after the Fed delivered its first rate hike since 2023, with the dot plot showing 16 of 18 officials expect at least one more increase this year. Here are the levels that matter for DXY, the currencies feeling it most, and what to watch next.
Author  Irene Q.
Yesterday 02: 45
The U.S. dollar index broke back above 100 for the first time since 31 July after the Fed delivered its first rate hike since 2023, with the dot plot showing 16 of 18 officials expect at least one more increase this year. Here are the levels that matter for DXY, the currencies feeling it most, and what to watch next.
goTop
quote