

Bitcoin Price Wobbles — Is A Sharp Downside Move On The Horizon?

Source Newsbtc

Bitcoin price is struggling to settle above $113,500 and $114,000. BTC is now consolidating and might start another decline below $110,000.

  • Bitcoin started a fresh decline after it failed to clear the $114,000 resistance level.
  • The price is trading below $113,000 and the 100 hourly Simple moving average.
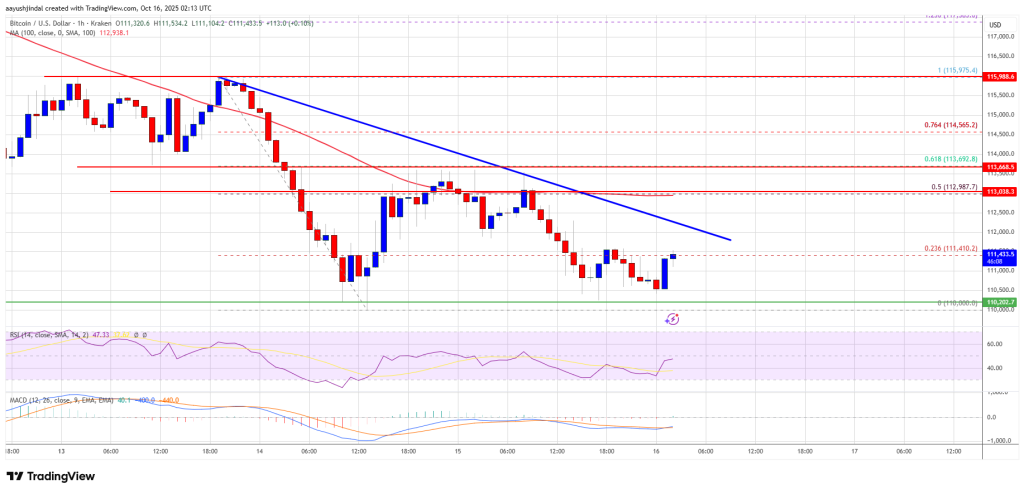
  • There is a bearish trend line forming with resistance at $112,000 on the hourly chart of the BTC/USD pair (data feed from Kraken).
  • The pair might continue to move down if it trades below the $110,200 zone.

Bitcoin Price Faces Hurdles

Bitcoin price started a recovery wave above the $112,500 resistance level. BTC recovered above the $112,800 and $113,000 resistance levels.

The price climbed above the 50% Fib retracement level of the recent decline from the $115,975 swing high to the $110,000 low. The bulls even pushed the price above the $113,500 resistance level. However, there are many hurdles on the upside.

Bitcoin is now trading below $113,000 and the 100 hourly Simple moving average. Besides, there is a bearish trend line forming with resistance at $112,000 on the hourly chart of the BTC/USD pair.

Immediate resistance on the upside is near the $112,000 level. The first key resistance is near the $113,000 level. The next resistance could be $113,700 and the 61.8% Fib retracement level of the recent decline from the $115,975 swing high to the $110,000 low.
Bitcoin Price

A close above the $113,700 resistance might send the price further higher. In the stated case, the price could rise and test the $114,500 resistance. Any more gains might send the price toward the $115,250 level. The next barrier for the bulls could be $115,500.

Another Decline In BTC?

If Bitcoin fails to rise above the $113,000 resistance zone, it could start a fresh decline. Immediate support is near the $110,200 level. The first major support is near the $110,000 level.

The next support is now near the $109,500 zone. Any more losses might send the price toward the $108,500 support in the near term. The main support sits at $107,200, below which BTC might struggle to recover in the short term.

Technical indicators:

Hourly MACD – The MACD is now gaining pace in the bearish zone.

Hourly RSI (Relative Strength Index) – The RSI for BTC/USD is now below the 50 level.

Major Support Levels – $110,200, followed by $110,000.

Major Resistance Levels – $112,000 and $113,000.

Disclaimer: For information purposes only. Past performance is not indicative of future results.
placeholder
Bitcoin falls below $75,000 as the CLARITY Act fails in the Senate — what the vote means for cryptoThe US Senate blocked the Digital Asset Market CLARITY Act in a 49-50 procedural vote, sending Bitcoin briefly below $75,000 — its biggest one-day drop since June. Ethereum fell more than 8%, Coinbase slid 10% and $75 billion of crypto market value evaporated. Here is what the vote was, why it failed, and the levels that matter now.
Author  Suzie
Sep 16, Wed
The US Senate blocked the Digital Asset Market CLARITY Act in a 49-50 procedural vote, sending Bitcoin briefly below $75,000 — its biggest one-day drop since June. Ethereum fell more than 8%, Coinbase slid 10% and $75 billion of crypto market value evaporated. Here is what the vote was, why it failed, and the levels that matter now.
placeholder
Dollar index tops 100 for the first time since July as the Fed's hawkish dot plot sinks inThe U.S. dollar index broke back above 100 for the first time since 31 July after the Fed delivered its first rate hike since 2023, with the dot plot showing 16 of 18 officials expect at least one more increase this year. Here are the levels that matter for DXY, the currencies feeling it most, and what to watch next.
Author  Irene Q.
Sep 17, Thu
The U.S. dollar index broke back above 100 for the first time since 31 July after the Fed delivered its first rate hike since 2023, with the dot plot showing 16 of 18 officials expect at least one more increase this year. Here are the levels that matter for DXY, the currencies feeling it most, and what to watch next.
placeholder
Gold ends three-week slide at the $4,400 line — eight straight days of ETF inflows vs a 5% 10-year and a 100 dollarSpot gold closed Friday at $4,378.39, up 0.84% on the day and about 0.8% for the week — its first weekly gain in four weeks — with the intraday high of $4,399.67 leaving it 33 cents shy of the $4,400 line. Gold ETFs have now logged eight straight sessions of inflows, but with the 10-year back above 5% and the dollar index near 100, here is what decides whether this is a reversal or a bounce.
Author  Suzie
Yesterday 05: 53
Spot gold closed Friday at $4,378.39, up 0.84% on the day and about 0.8% for the week — its first weekly gain in four weeks — with the intraday high of $4,399.67 leaving it 33 cents shy of the $4,400 line. Gold ETFs have now logged eight straight sessions of inflows, but with the 10-year back above 5% and the dollar index near 100, here is what decides whether this is a reversal or a bounce.
placeholder
Bitcoin squeezes back above $80,000 — 110,000 traders liquidated as the hawkish Fed and CLARITY setback fail to hold it down; is $83,000 next?Bitcoin closed above $80,000 on Friday for the first time since September 7, and pushed to $81,299 over the weekend, triggering about $603 million of liquidations — $523 million of them shorts — across more than 110,000 traders. With the Fed's hike already priced and the SEC and CFTC advancing crypto rules after the CLARITY Act failed, here is what stands between BTC and the $83,000 gate.
Author  Suzie
Yesterday 06: 19
Bitcoin closed above $80,000 on Friday for the first time since September 7, and pushed to $81,299 over the weekend, triggering about $603 million of liquidations — $523 million of them shorts — across more than 110,000 traders. With the Fed's hike already priced and the SEC and CFTC advancing crypto rules after the CLARITY Act failed, here is what stands between BTC and the $83,000 gate.
placeholder
Brent slides below $102 after Houthis' first strike on Riyadh — why oil can't hold $100Houthi forces struck Riyadh for the first time on September 19 and hit Yanbu facilities — yet Brent opened at $104.71, peaked at $104.90 and settled at $101.68 (-1.63% on the day). Here is the four-way data tug-of-war between strike escalation and supply recovery, and the two switches that decide where oil goes next.
Author  Irene Q.
11 hours ago
Houthi forces struck Riyadh for the first time on September 19 and hit Yanbu facilities — yet Brent opened at $104.71, peaked at $104.90 and settled at $101.68 (-1.63% on the day). Here is the four-way data tug-of-war between strike escalation and supply recovery, and the two switches that decide where oil goes next.
goTop
quote