HBAR Nears 3-Month Breakout — But Liquidity Outflows Could Spoil It

Source Beincrypto

HBAR’s recent rally has placed the altcoin within striking distance of breaking out from a critical three-month pattern. Despite the market’s bullish momentum, investor behavior may hinder its progress. 

While the broader crypto market shows renewed optimism, HBAR holders appear hesitant, creating a disconnect between sentiment and price action.

Hedera Investors Are Losing Confidence

The Relative Strength Index (RSI) for HBAR is climbing steadily, reentering the bullish zone above the neutral 50.0 mark. This shift signals renewed buying interest and improving technical strength. As market-wide sentiment turns positive, indicators suggest that HBAR could soon regain upward momentum if sustained demand persists.

The improving macro environment is also aiding HBAR’s short-term outlook. With Bitcoin and other major cryptocurrencies posting fresh gains, overall market conditions have strengthened considerably.

Want more token insights like this? Sign up for Editor Harsh Notariya’s Daily Crypto Newsletter here.

HBAR RSI
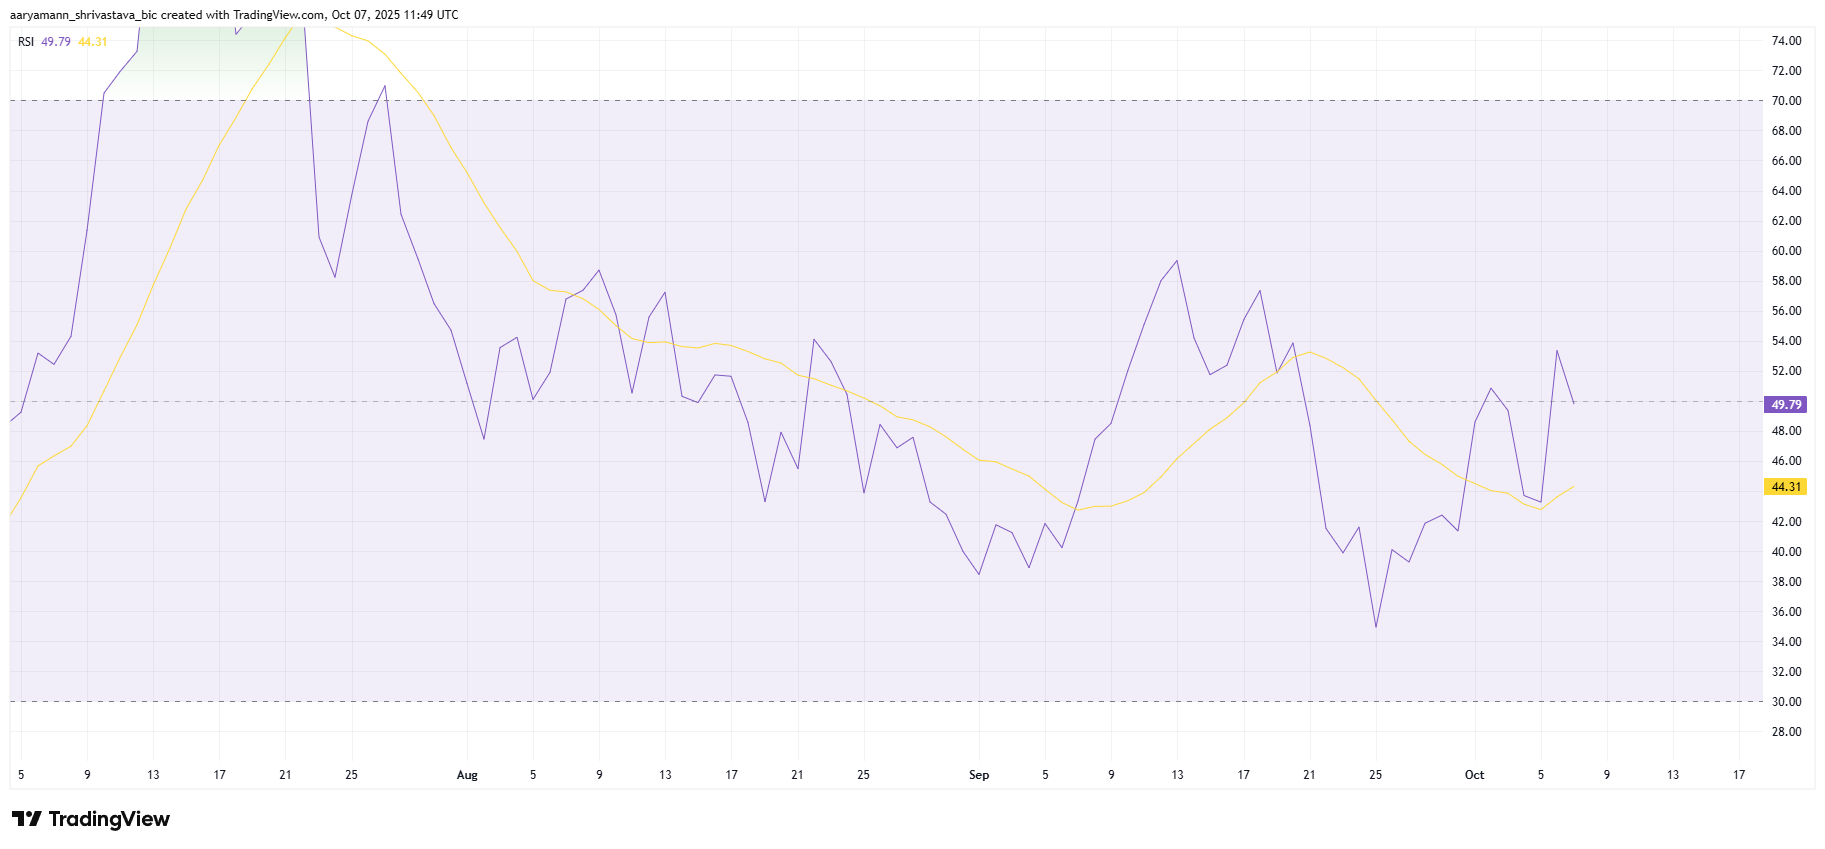
HBAR RSI. Source: TradingView

However, not all signs point to an easy rally. The Chaikin Money Flow (CMF), a key measure of capital inflow and outflow, recently dipped below the zero line, marking a monthly low. This decline reveals that investors are withdrawing liquidity from HBAR, signaling uncertainty around its ability to sustain a breakout.

The weakening CMF highlights an imbalance between growing market optimism and cautious investor participation. While bullish sentiment dominates much of the crypto market, HBAR’s holders remain wary of potential short-term reversals.

HBAR CMF
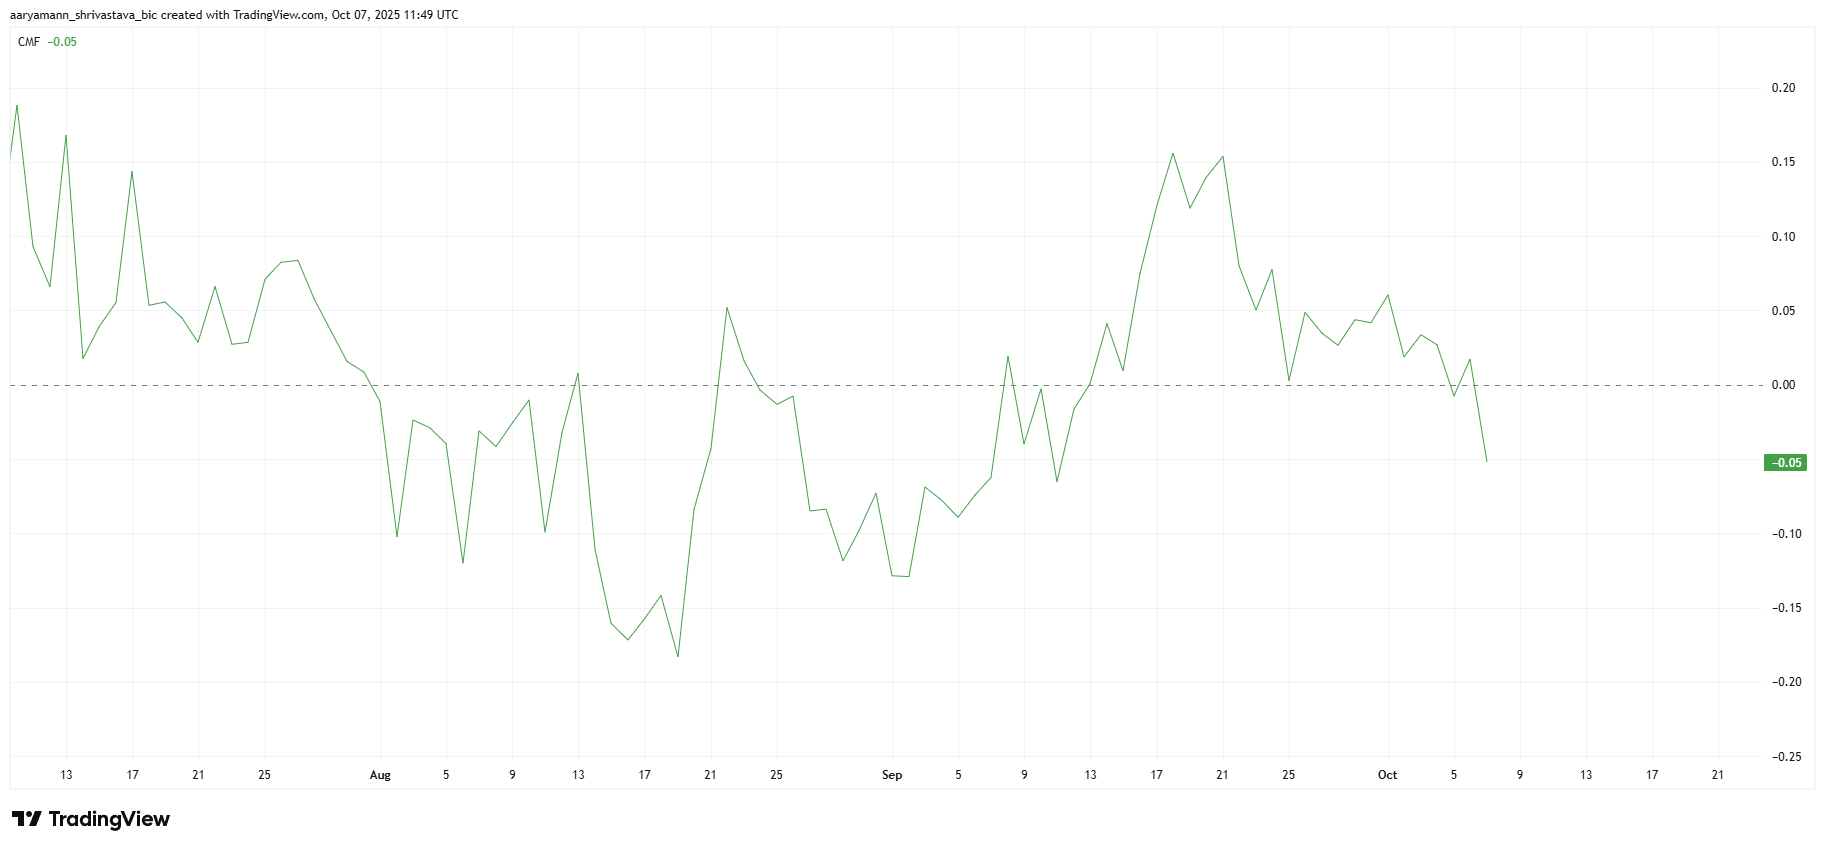
HBAR CMF. Source: TradingView

HBAR Price May Not Breakout

HBAR is trading at $0.224, sitting just below the crucial $0.230 resistance level — the breakout point from its descending wedge pattern that has persisted for three months. A decisive move above this level could trigger renewed bullish momentum.

Historically, HBAR has struggled to break free from this setup, and a failed attempt could push prices lower. If rejection occurs, the token might slip toward $0.219 or $0.213, with further downside potential to $0.205.

HBAR Price Analysis. 
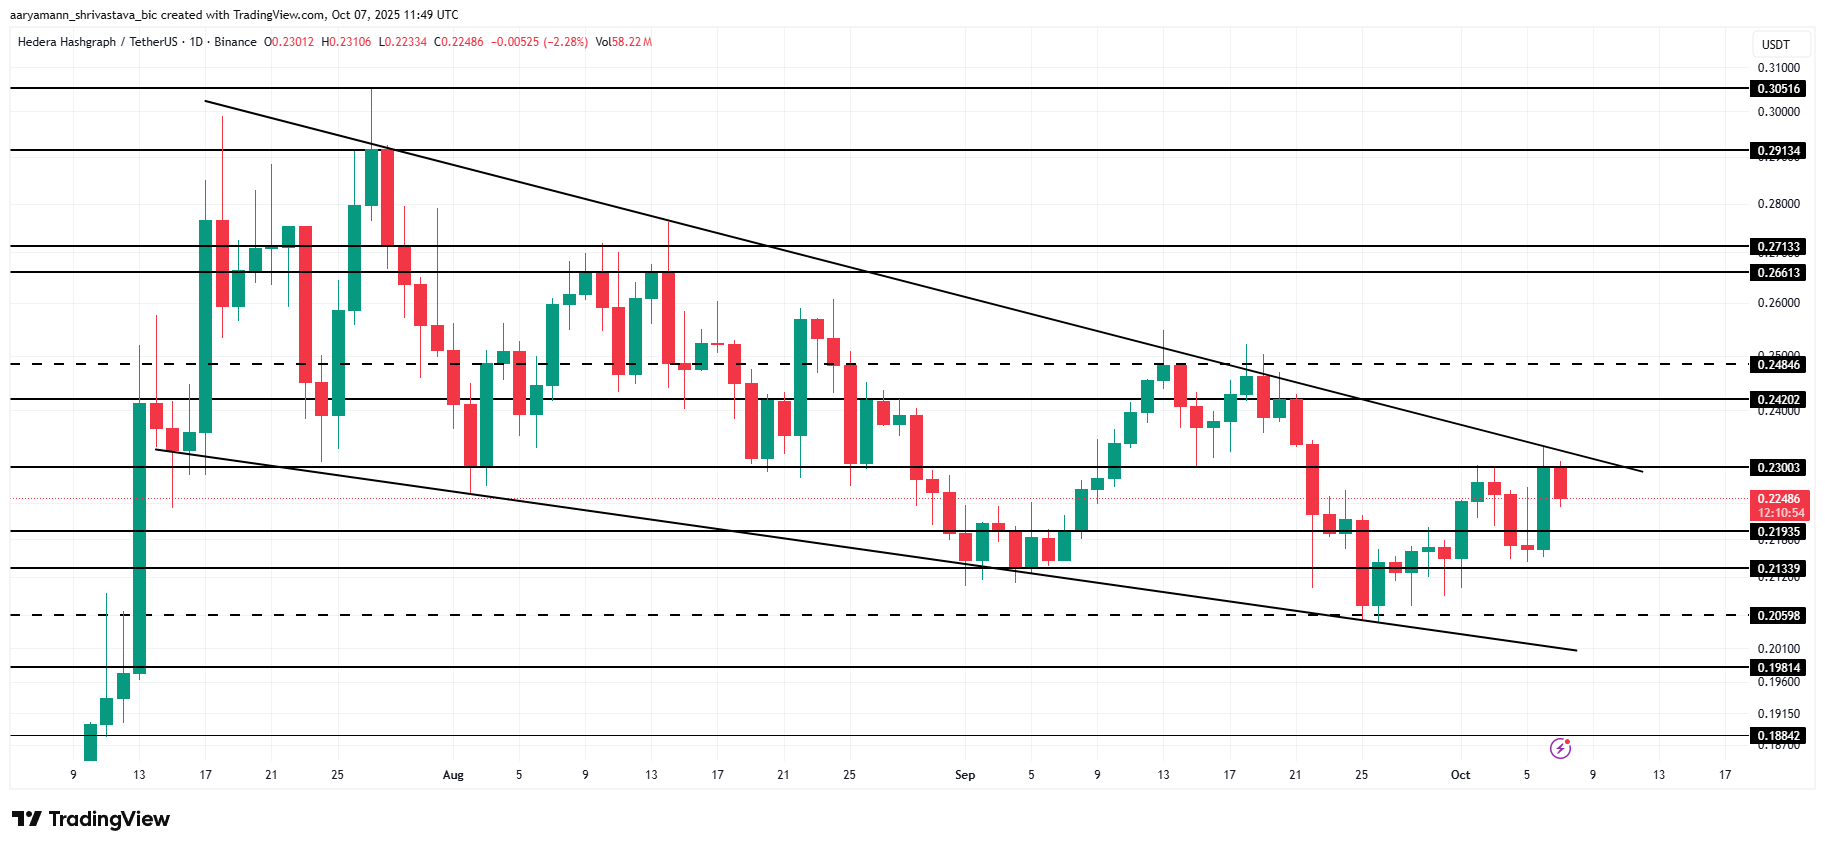
HBAR Price Analysis. Source: TradingView

Conversely, if broader market strength outweighs investor skepticism, HBAR price could breach $0.230 and confirm a breakout. This move could propel the price toward $0.242, invalidating the bearish outlook and marking the start of a new bullish phase.

Disclaimer: For information purposes only. Past performance is not indicative of future results.
placeholder
Natural Gas sinks to pivotal level as China’s demand slumpsNatural Gas price (XNG/USD) edges lower and sinks to $2.56 on Monday, extending its losing streak for the fifth day in a row. The move comes on the back of China cutting its Liquified Natural Gas (LNG) imports after prices rose above $3.0 in June. It
Author  FXStreet
Jul 01, 2024
Natural Gas price (XNG/USD) edges lower and sinks to $2.56 on Monday, extending its losing streak for the fifth day in a row. The move comes on the back of China cutting its Liquified Natural Gas (LNG) imports after prices rose above $3.0 in June. It
placeholder
ECB Policy Outlook for 2026: What It Could Mean for the Euro’s Next MoveWith the ECB likely holding rates steady at 2.15% and the Fed potentially extending cuts into 2026, EUR/USD may test 1.20 if Eurozone growth proves resilient, but weaker growth and an ECB pivot could pull the pair back toward 1.13 and potentially 1.10.
Author  Mitrade
Dec 26, 2025
With the ECB likely holding rates steady at 2.15% and the Fed potentially extending cuts into 2026, EUR/USD may test 1.20 if Eurozone growth proves resilient, but weaker growth and an ECB pivot could pull the pair back toward 1.13 and potentially 1.10.
placeholder
U.S.-Iran Standoff Suddenly Escalates Over Weekend, Crude Jumps 8% at Monday OpenOver the weekend, the U.S. and Iran engaged in a new round of maneuvering over the situation in the Middle East, leading to a rapid escalation in geopolitical risks. As a result, internat
Author  TradingKey
Apr 20, Mon
Over the weekend, the U.S. and Iran engaged in a new round of maneuvering over the situation in the Middle East, leading to a rapid escalation in geopolitical risks. As a result, internat
placeholder
Gold holds steady above $4,800 amid US-Iran ceasefire uncertainty Gold price (XAU/USD) trades on a flat note near $4,825 during the early Asian session on Tuesday. The precious metal steadies amid renewed geopolitical instability in the Middle East.  
Author  FXStreet
Apr 21, Tue
Gold price (XAU/USD) trades on a flat note near $4,825 during the early Asian session on Tuesday. The precious metal steadies amid renewed geopolitical instability in the Middle East.  
placeholder
WTI sticks to positive bias above $92.00 amid Middle East tensionsWest Texas Intermediate (WTI) – the benchmark US Crude Oil price – fades an Asian session spike to the $95.80-$95.85 area, or a one-and-a-half-week top, and retreats to the lower end of its daily range in the last hour.
Author  FXStreet
8 hours ago
West Texas Intermediate (WTI) – the benchmark US Crude Oil price – fades an Asian session spike to the $95.80-$95.85 area, or a one-and-a-half-week top, and retreats to the lower end of its daily range in the last hour.
goTop
quote