

Bitcoin Price Forecast: BTC steadies as ETF outflows, long liquidations signal bearish outlook
- Bitcoin price steadies around $113,000 on Tuesday following a 2.24% decline the previous day.
- US-listed spot BTC ETFs recorded an outflow of $368 million on Monday, with data indicating massive liquidation in long positions.
- The technical outlook suggests a resume of the correction as a dead-cat scenario unfolds.
Bitcoin (BTC) price steadies around $113,00 at the time of writing on Tuesday after falling 2.24% the previous day. The recent price correction has triggered a massive liquidation in the cryptocurrency market, the highest single-day liquidation so far this year. Moreover, the US-listed spot BTC Exchange Traded Fund (ETFs) recorded an outflow of $368 million on Monday, supporting the bearish view. The technical outlook also suggests a resumption of the correction as a dead-cat scenario unfolds in the 4-hour chart.
Largest single-day long liquidation
Bitcoin price started the week on a bearish note, slipping 2.24% on Monday and hitting a low of $111,478 during Tuesday’s Asian trading session. According to Coinglass data, this price decline has triggered the largest single-day liquidation in the broad crypto market so far this year, with $1.65 billion in long positions wiped out compared to just $145.83 million in shorts, underscoring excessive bullishness among traders.
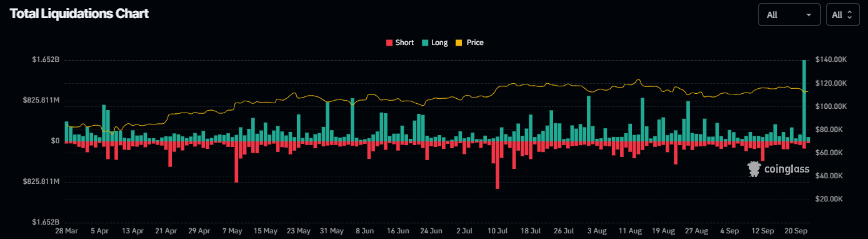
Total liquidations chart. Source: Coinglass
In Bitcoin’s case, it marked the highest single-day liquidation since mid-June, with $285.92 million in long positions wiped out compared to just $15.14 million in shorts, effectively flushing excess leveraged long positions from the market.
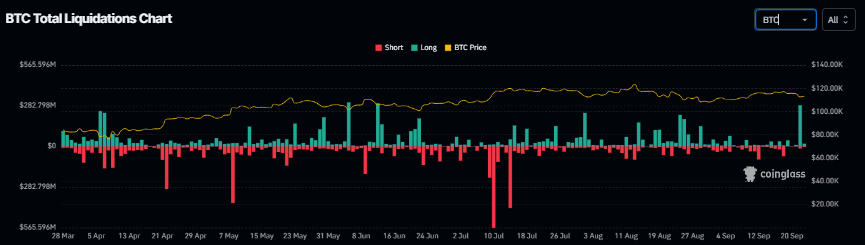
BTC total liquidation chart. Source: Coinglass
Despite the liquidations, CryptoQuant’s BTC Estimated Leverage Ratio (ELR) stands at 0.286 on Tuesday, close to its yearly peak of 0.291 recorded on September 11, yet still well below the record high of 0.358 in 2011, suggesting that traders remain moderately leveraged but not excessively overexposed.
-1758623921338-1758623921340.png)
Bitcoin Estimated Leverage Ratio chart. Source: CryptoQuant
US-listed spot Bitcoin ETFs record an outflow
SoSoValue data shows that Bitcoin spot ETFs recorded an outflow of $368.17 million on Monday, the highest single-day outflow since mid-August.
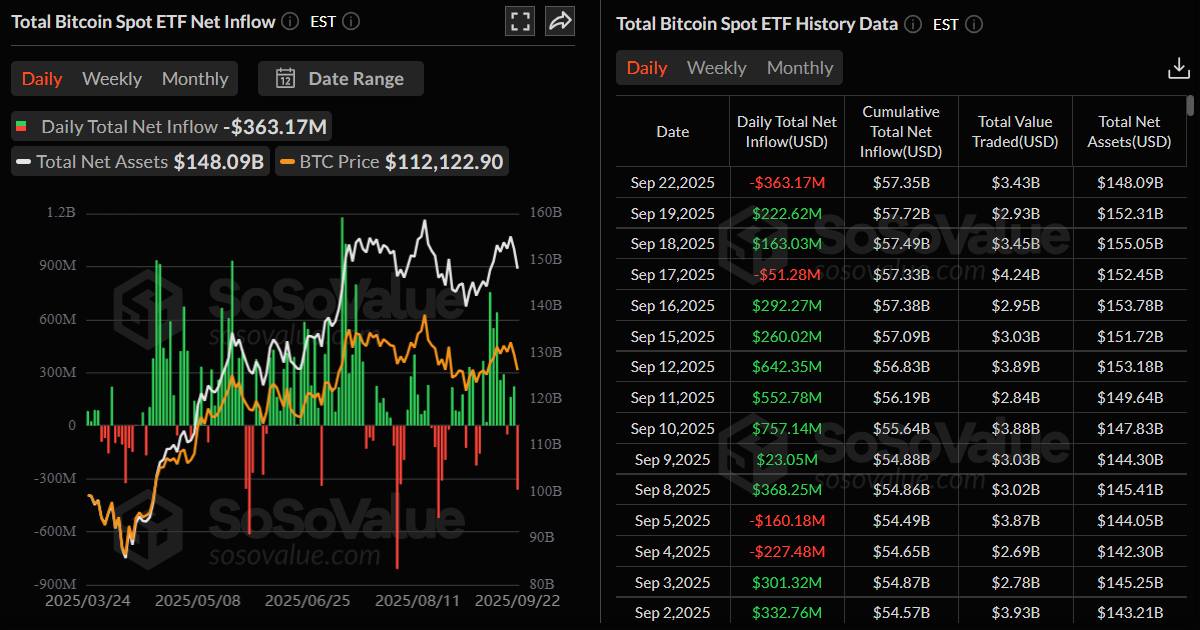
Bitfinex analysts told FXStreet that Bitcoin is consolidating around $112,000 this week following ETF outflows of approximately $363 million on Monday. If ETF flows stabilize and funding conditions remain neutral, BTC could retest $115,000 by the end of the week, while a breakdown of key support could push prices down toward $108,000.
The analyst forecasts that Bitcoin could trade in the $115,000–$118,000 range by the end of September under the base case, assuming Friday’s US Personal Consumption Expenditures (PCE) inflation data confirms disinflation and the Federal Reserve (Fed) signals further easing. In a bear scenario, BTC could pull back to $104,000–$106,000 if inflation remains high and ETF outflows continue.
Some signs of optimism
Despite the recent price drop, corporate demand remains strong. Strategy announced on Monday that the firm had added 850 BTC to its reserve, bringing the total holding to 639,835.

During the same period, Japanese investment firm Metaplanet announced that it had purchased an additional 5,419 BTC, bringing the total holding to 25,555 BTC. Moreover, Europe’s First Bitcoin Treasury Company, Capital B, also added 551 BTC to its treasury reserves, now holding a total of 2,800 BTC.
Shawn Young, Chief Analyst at MEXC, told FXStreet that, "The sell-off also spilt into crypto equities, where crypto treasury firms' stocks slipped despite companies announcing new digital asset purchases. This reflects the current investor skepticism in portfolio expansion and exposure increment across the board until there is further clarity on market direction and the macro environment's influence on it. Balance-sheet strength and treasury purchases can only offer limited insulation when the core assets themselves are under this kind of macro-induced pressure. While liquidation events are not ideal, these kinds of resets are not uncommon in crypto’s market structural cycles. They often help to clear excess leverage fumes from the market and create a cleaner base for renewed price discovery movements."
Bitcoin Price Forecast: Dead cat bounce scenario unfolds
Bitcoin on the 4-hour chart shows that it broke below an ascending trendline (drawn by connecting multiple lows since early September) on Sunday and closed below the 50-day Exponential Moving Average (EMA). At the start of this week, on Monday, BTC declined 2.24%. When writing on Tuesday, it recovers slightly, trading at around $112,900.
In this scenario, BTC might experience a dead-cat bounce — a brief price increase within a broader downtrend — potentially facing rejection from the former 50-period EMA on the 4-hour chart at $114,790, which also aligns with the 50% Fibonacci retracement level at $114,714 (drawn from Thursday’s high of $117,900 to Tuesday’s low of $111,529), marking it as a crucial reversal zone.
Failure to break above the $114,790 level might trigger a correction toward the daily support at $107,429.
The Relative Strength Index (RSI) on the 4-hour chart read 36, bouncing above the oversold level, which suggests that BTC could recover toward the aforementioned reversal levels before resuming its downward trend.
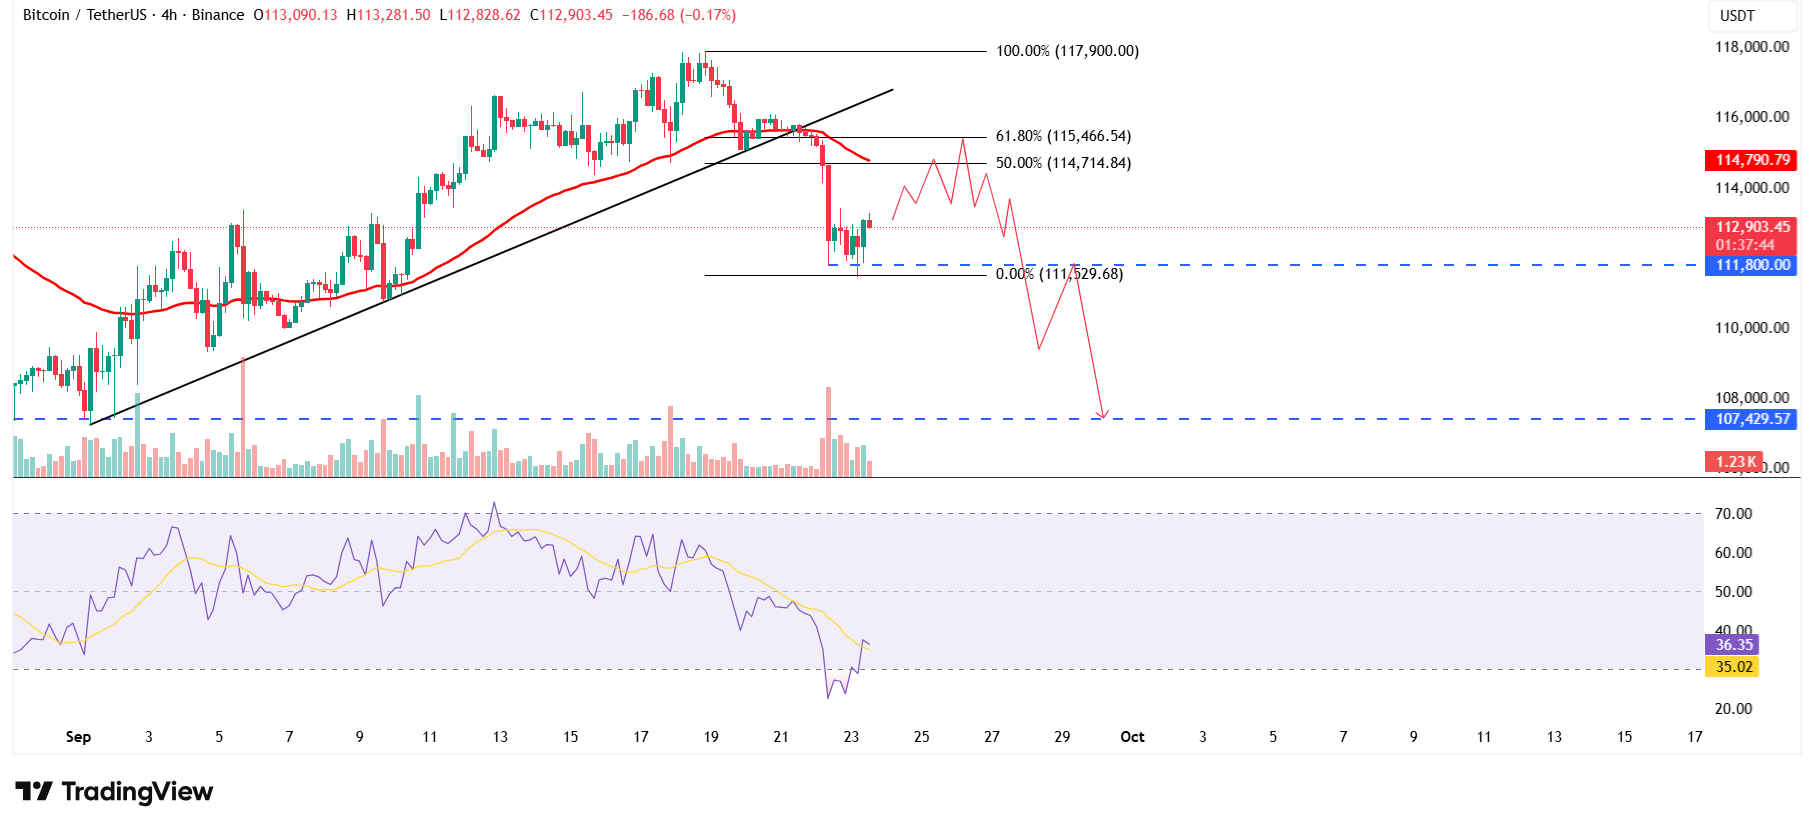
BTC/USDT 4-hour chart
On the daily chart, BTC price broke below its daily support level at $116,000 on Friday and declined slightly over the weekend. At the start of this week on Monday, it continued its correction by 2.2% and closed below its 50-day EMA at $113,898.
If BTC faces a rejection from the 50-day EMA and continues its correction, it could extend the decline toward its next daily support at $107,245.
The Relative Strength Index (RSI) on the daily chart reads 45, below its neutral level of 50, indicating bearish momentum. The Moving Average Convergence Divergence (MACD) showed a bearish crossover on Monday, giving a sell signal and further supporting the bearish view.
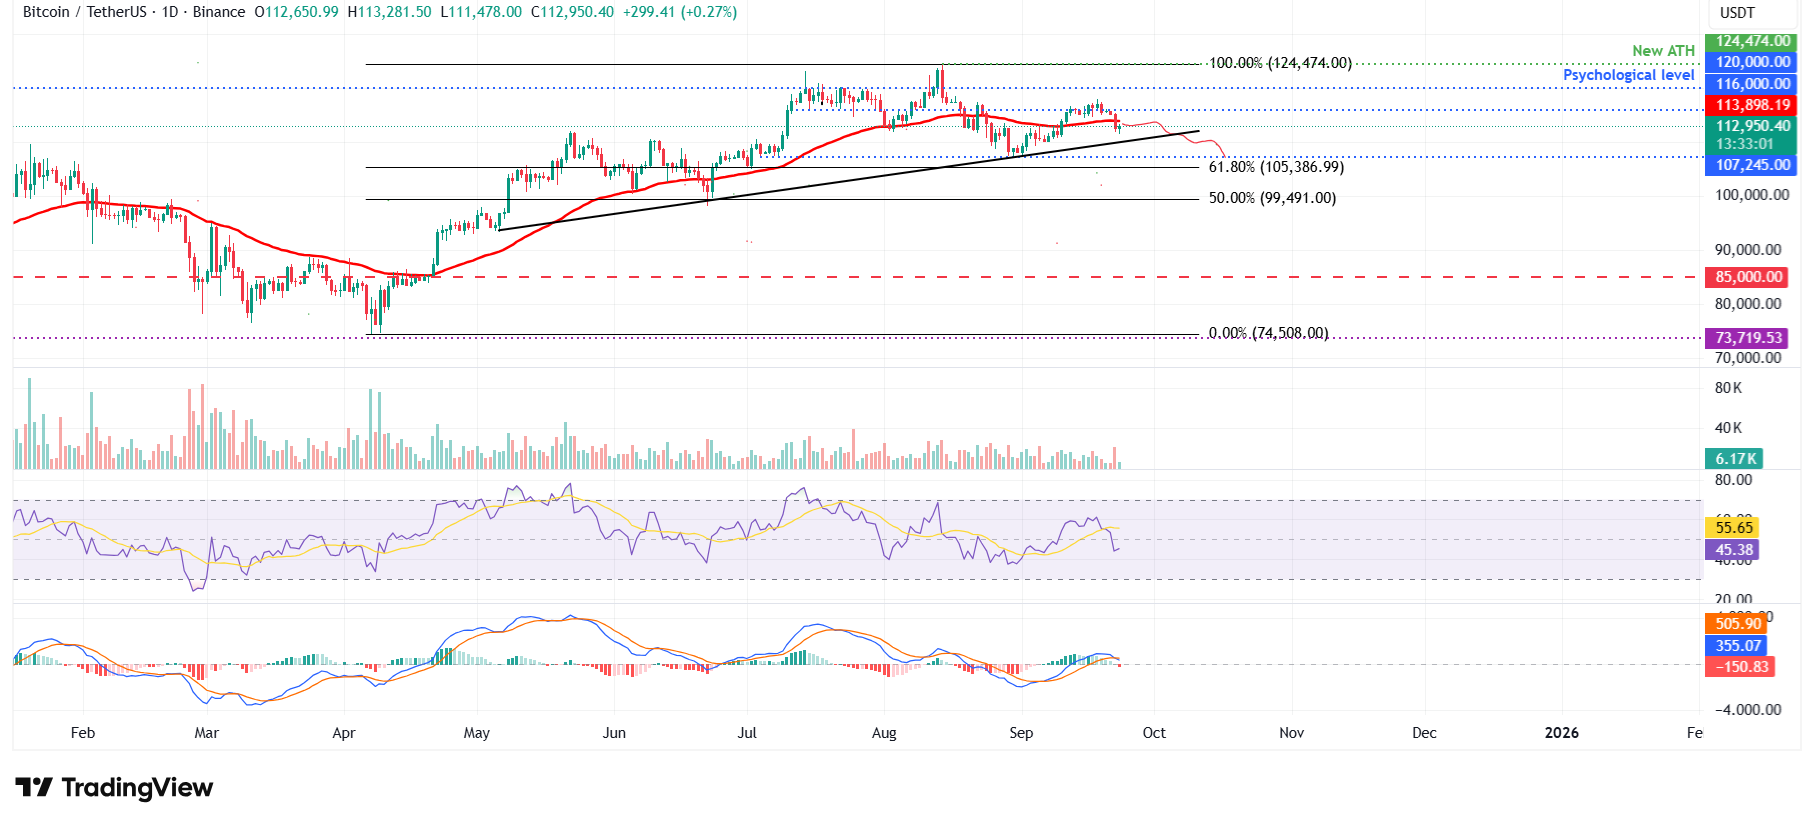
BTC/USDT daily chart
However, if BTC recovers, it could extend the recovery toward its daily resistance at $116,000.
Bitcoin, altcoins, stablecoins FAQs
Bitcoin is the largest cryptocurrency by market capitalization, a virtual currency designed to serve as money. This form of payment cannot be controlled by any one person, group, or entity, which eliminates the need for third-party participation during financial transactions.
Altcoins are any cryptocurrency apart from Bitcoin, but some also regard Ethereum as a non-altcoin because it is from these two cryptocurrencies that forking happens. If this is true, then Litecoin is the first altcoin, forked from the Bitcoin protocol and, therefore, an “improved” version of it.
Stablecoins are cryptocurrencies designed to have a stable price, with their value backed by a reserve of the asset it represents. To achieve this, the value of any one stablecoin is pegged to a commodity or financial instrument, such as the US Dollar (USD), with its supply regulated by an algorithm or demand. The main goal of stablecoins is to provide an on/off-ramp for investors willing to trade and invest in cryptocurrencies. Stablecoins also allow investors to store value since cryptocurrencies, in general, are subject to volatility.
Bitcoin dominance is the ratio of Bitcoin's market capitalization to the total market capitalization of all cryptocurrencies combined. It provides a clear picture of Bitcoin’s interest among investors. A high BTC dominance typically happens before and during a bull run, in which investors resort to investing in relatively stable and high market capitalization cryptocurrency like Bitcoin. A drop in BTC dominance usually means that investors are moving their capital and/or profits to altcoins in a quest for higher returns, which usually triggers an explosion of altcoin rallies.
Recommended Articles


