
Bitcoin Price Turns Bullish Above $114,000 With Hidden Divergence Forming

Source Newsbtc

Bitcoin’s price action has managed to break above $115,000 after spending the majority of the past two weeks trading below this level. Bitcoin is now holding firm above $114,000, and the leading cryptocurrency has regained momentum over the past week that shows signs of renewed bullish strength. 

According to technical analysis, a hidden bullish divergence is forming with the recent price action this week, and this could be the setup that pushes Bitcoin to new price highs.

Bitcoin Revealing Hidden Bullish Divergence

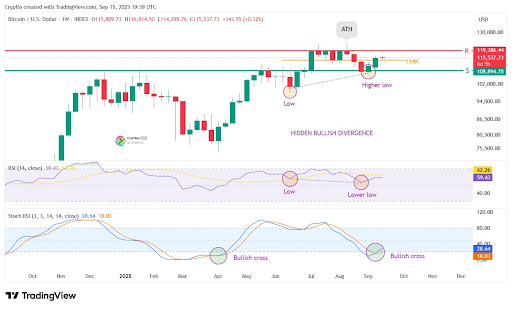
Technical analysis of Bitcoin’s weekly candlestick timeframe chart, which was posted on the social media platform X by crypto analyst CrypFlow, shows that Bitcoin could be on track to resume its journey of new all-time highs.

Last week’s close means that Bitcoin has confirmed a higher price low in the weekly timeframe following the pullback that began after its August all-time high. As shown in the weekly candlestick chart below, this low is a higher low compared to June’s low below $100,000. 
Bitcoin

On the other hand, while the price printed a higher low, the Relative Strength Index (RSI) posted a lower low in the same time frame. This mismatch between price and momentum creates what is called a hidden bullish divergence, which is a technical pattern that suggests bullish continuation. 

The weekly candlestick chart shared by CrypFlow shows Bitcoin defending an important support level around $114,000 and is now on two bullish weekly candlesticks. According to the analyst, if this divergence is confirmed as expected, it could provide the foundation for Bitcoin to push to new highs again. At the time of writing, Bitcoin is trading 5.7% below its current all-time high of $124,128.

Stochastic RSI Flips Bullish

The stochastic RSI indicator on the weekly timeframe has just flipped bullish, though confirmation will depend on how Bitcoin closes in the coming sessions. The last time such a bullish flip occurred on the weekly timeframe was in April, just before Bitcoin kickstarted a run that saw it close at bullish prices for seven consecutive weeks. A similar playout could see Bitcoin register at least five more bullish weekly closes in the coming weeks.

The upcoming macroeconomic events could introduce volatility into the crypto industry, and this is worth keeping an eye on. The Federal Open Market Committee (FOMC) is set to meet on Wednesday, and expectations are running high that policymakers will announce an interest rate cut of 25 basis points or possibly even 50 basis points. An interest rate cut could have different effects, and history has shown that this could shift investor sentiment toward Bitcoin and other large-cap cryptocurrencies.

At the time of writing, Bitcoin is trading at $117,040, already playing out bullish continuation by being up by 9% from its September open.

Bitcoin
Disclaimer: For information purposes only. Past performance is not indicative of future results.
placeholder
Japanese Yen rallies to February 18 high as upbeat wage data and GDP lift BoJ hike betsThe USD/JPY pair declines for the second straight day – also marking the fourth day of a fall in the previous five – and sinks to its lowest level since February 18, around mid-153.00s during the Asian session on Tuesday.
Author  FXStreet
Sep 08, Tue
The USD/JPY pair declines for the second straight day – also marking the fourth day of a fall in the previous five – and sinks to its lowest level since February 18, around mid-153.00s during the Asian session on Tuesday.
placeholder
US dollar clings to nine-week lows near 98.4 as Brent nears $100 and the yen hits a seven-month high — five events to watch todayThe dollar is pinned near nine-week lows even after a blockbuster jobs report, as an oil spike toward $100, a surging yen and China's reflation data crowd the driver's seat. Five key events to watch today: Brent at $99.46, USD/JPY at 154, China CPI/PPI, PBOC gold buying, and Thursday's PPI / Friday's CPI ahead of the September 15-16 FOMC.
Author  Eric Nkando
Sep 09, Wed
The dollar is pinned near nine-week lows even after a blockbuster jobs report, as an oil spike toward $100, a surging yen and China's reflation data crowd the driver's seat. Five key events to watch today: Brent at $99.46, USD/JPY at 154, China CPI/PPI, PBOC gold buying, and Thursday's PPI / Friday's CPI ahead of the September 15-16 FOMC.
placeholder
Brent holds above $100 as tanker attacks tighten supply — but four forces are capping the rallyBrent crude is holding above $100 a barrel for a second session, its first close above the level since late July, as tanker attacks near the Strait of Hormuz squeeze an already tight physical market. Yet the rally has been gradual: 8.3 mb/d of Gulf output is still shut in, diesel is at a record, and forecasts now range from $74 to $100.
Author  Irene Q.
Sep 10, Thu
Brent crude is holding above $100 a barrel for a second session, its first close above the level since late July, as tanker attacks near the Strait of Hormuz squeeze an already tight physical market. Yet the rally has been gradual: 8.3 mb/d of Gulf output is still shut in, diesel is at a record, and forecasts now range from $74 to $100.
placeholder
US August CPI lands tonight: after a 5.4% PPI shock, will the Fed hike on September 16?US August PPI came in at 5.4% year-on-year, above the 5.3% consensus, with core PPI at 4.6%. Traders have pushed the odds of a 25bp Fed hike on September 15-16 to around 70%. Tonight's CPI is the last major inflation print before the decision — here is the full calendar, the consensus numbers, and what a hot versus cool reading would mean for the dollar, yields, gold and stocks.
Author  Irene Q.
Sep 11, Fri
US August PPI came in at 5.4% year-on-year, above the 5.3% consensus, with core PPI at 4.6%. Traders have pushed the odds of a 25bp Fed hike on September 15-16 to around 70%. Tonight's CPI is the last major inflation print before the decision — here is the full calendar, the consensus numbers, and what a hot versus cool reading would mean for the dollar, yields, gold and stocks.
placeholder
Gold Price Forecast: PPI and Oil Prices Fuel Inflation Concerns, Can CPI Change Gold's Direction?As of the Asian session on September 11, gold prices (XAUUSD) remained in weak consolidation today after dropping sharply to near $4,300 on Thursday, with the latest price trading around
Author  TradingKey
Sep 11, Fri
As of the Asian session on September 11, gold prices (XAUUSD) remained in weak consolidation today after dropping sharply to near $4,300 on Thursday, with the latest price trading around
goTop
quote