

Sei Price Forecast: Chainlink Data Streams launch on the SEI network
- Sei price extends gains on Thursday after rebounding off its 200-day EMA at $0.286.
- Chainlink Data Streams go live on Sei, becoming the preferred oracle infrastructure for the network.
- Derivatives data back a bullish thesis amid rising SEI open interest and bullish bets reaching the highest level in over a month.
Sei (SEI) price extends its gains, trading above $0.325 at the time of writing on Thursday after rebounding over 10% from its key support level so far this week. Sei Development Foundation and Chainlink announced that Chainlink Data Streams are now live on the network, strengthening Sei’s infrastructure for DeFi and institutional-grade applications. Meanwhile, derivatives data paint a bullish picture with open interest rising and long bets climbing to monthly highs.
Sei integrates Chainlink Data, strengthens ecosystem
The Sei Development Foundation and Chainlink announced on Wednesday that Chainlink Data Streams are now live on Sei as the preferred oracle infrastructure for the Sei Network.
This integration follows Chainlink’s recent partnership with the US Department of Commerce, which will bring Bureau of Economic Analysis data on-chain to the Sei Network, including Real Gross Domestic Product (GDP) level, the Personal Consumption Expenditure (PCE) index, and the Real Final Sales to Private Domestic Purchasers level, along with their respective percentage changes.
“Federal macroeconomic data now flowing directly into on-chain markets, the combination of Chainlink’s institutional-grade oracle network and Sei’s sub-second settlement capabilities, positions the ecosystem at the forefront of a new era where traditional financial data and high-performance blockchain infrastructure converge to unlock unprecedented trading opportunities and institutional use cases,” says Sei in its press release.
This partnership is bullish for the Sei network in the long term, as it enhances the ecosystem with secure, real-time, and verifiable on-chain data, thereby strengthening Sei’s infrastructure for Decentralized Finance (DeFi) and institutional-grade applications, while boosting investor confidence and attracting both DeFi builders and institutional players.
Sei’s bullish derivatives market
Futures’ open interest in Sei at exchanges rose from $230 million on Sunday to $285.92 million on Thursday, the highest level since August 25. Rising OI represents new or additional money entering the market and new buying, which could fuel the current SEI price rally.
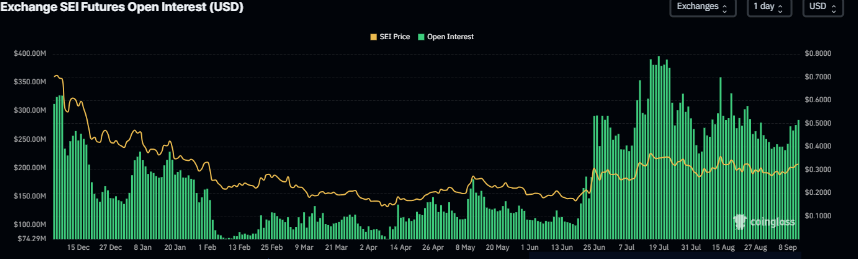
Sei’s open interest chart. Source: Coinglass
Apart from rising open interest, the bullish bets among traders stand at 1.20 on Thursday, the highest level in over a month, reflecting bullish sentiment in the markets.
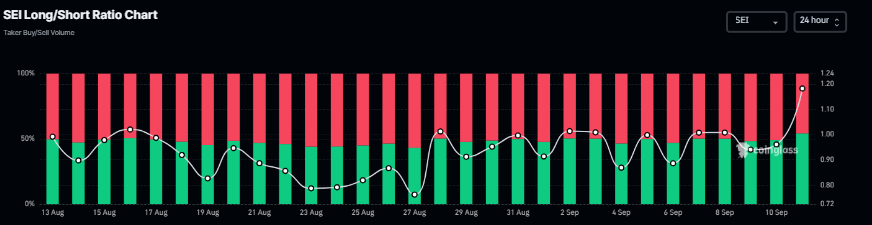
SEI long-to-short ratio chart. Source: Coinglass
Sei Price Forecast: SEI rebounds following test of key support
Sei price retested and found support around its 200-day Exponential Moving Average (EMA) level at $0.286 on Saturday, and rallied by over 12% in the next four days. At the time of writing on Thursday, it continues to trade higher at around $0.325.
If SEI continues its upward momentum and breaks above the descending trendline, it could extend the rally toward its 50% price retracement level at $0.433.
The Relative Strength Index (RSI) on the daily chart reads 57, which is above its neutral level of 50, indicating that bullish momentum is gaining traction. The Moving Average Convergence Divergence (MACD) indicator showed a bullish crossover on Monday, providing a buy signal. Moreover, it also shows rising green histogram bars above its neutral level, indicating bullish momentum and an upward trend ahead.
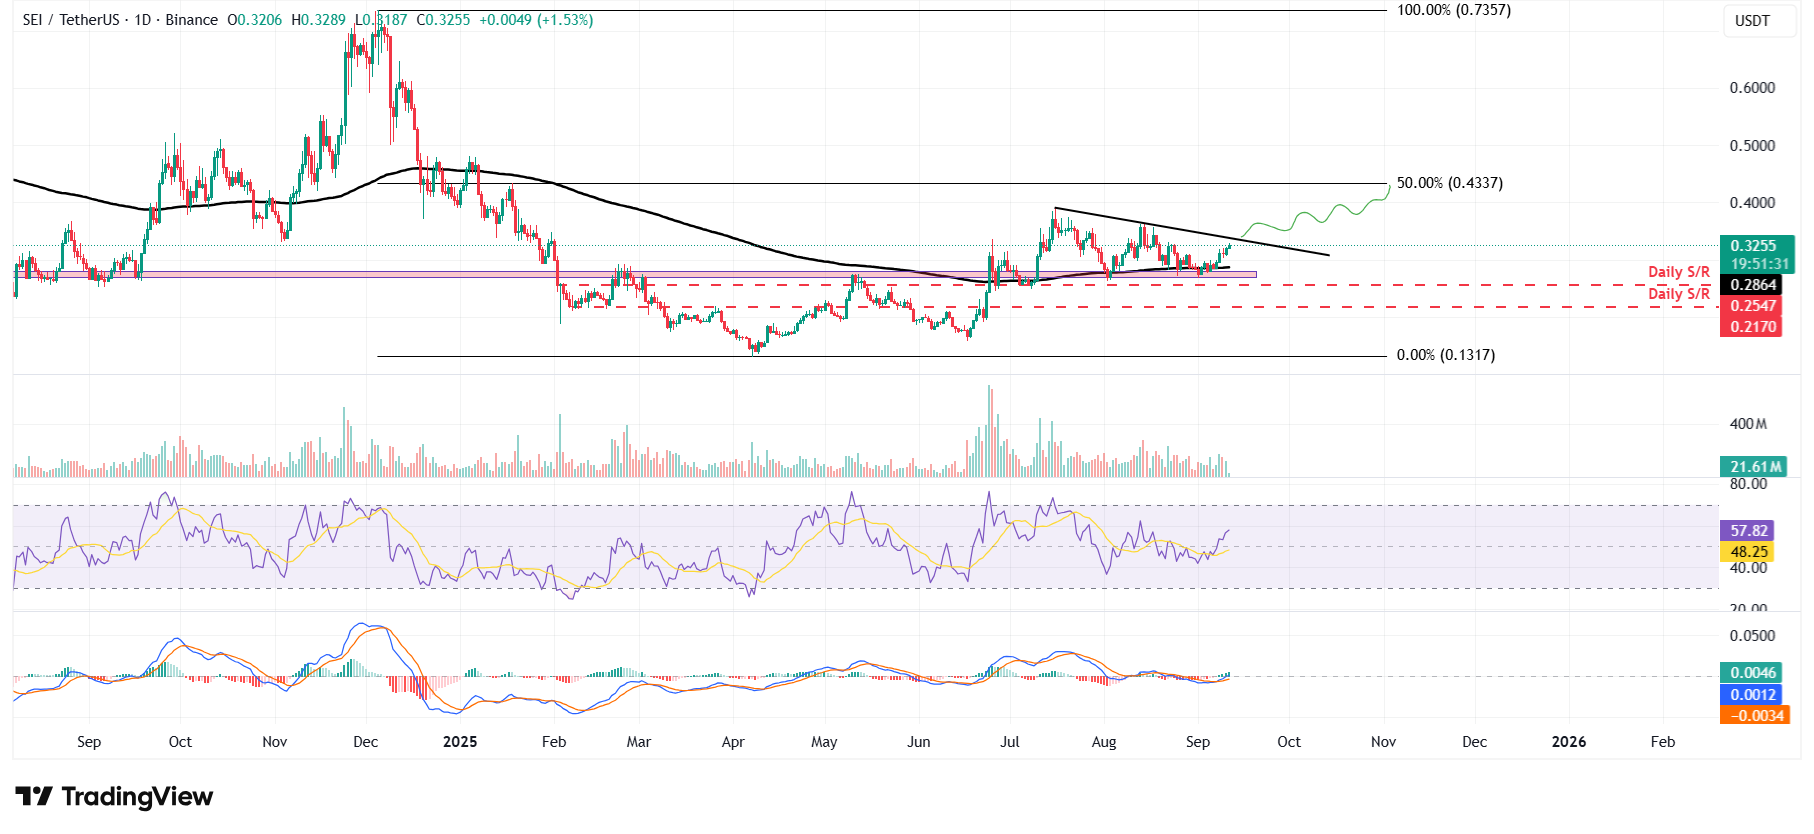
SEI/USDT daily chart
However, if SEI faces a correction, it could extend the decline toward its 200-day EMA at $0.286.
Recommended Articles


