
Cardano Price Forecast: ADA gears up for a potential breakout run

Source Fxstreet
  • Cardano edges higher within a falling wedge pattern, with bulls targeting a breakout rally. 
  • Optimism remains steady among Cardano derivative traders.
  • On-chain data shows declining profit booking and active addresses.

Cardano (ADA) trades above $0.80 at press time on Friday, with bulls trying to overcome the 3.26% loss from the previous day. Cardano’s recovery teases a potential falling wedge pattern breakout on the 4-hour chart amid steady optimism among derivative traders. However, the on-chain data flash weakness as profits and network activity decline. 

On-chain data reveals underlying weakness

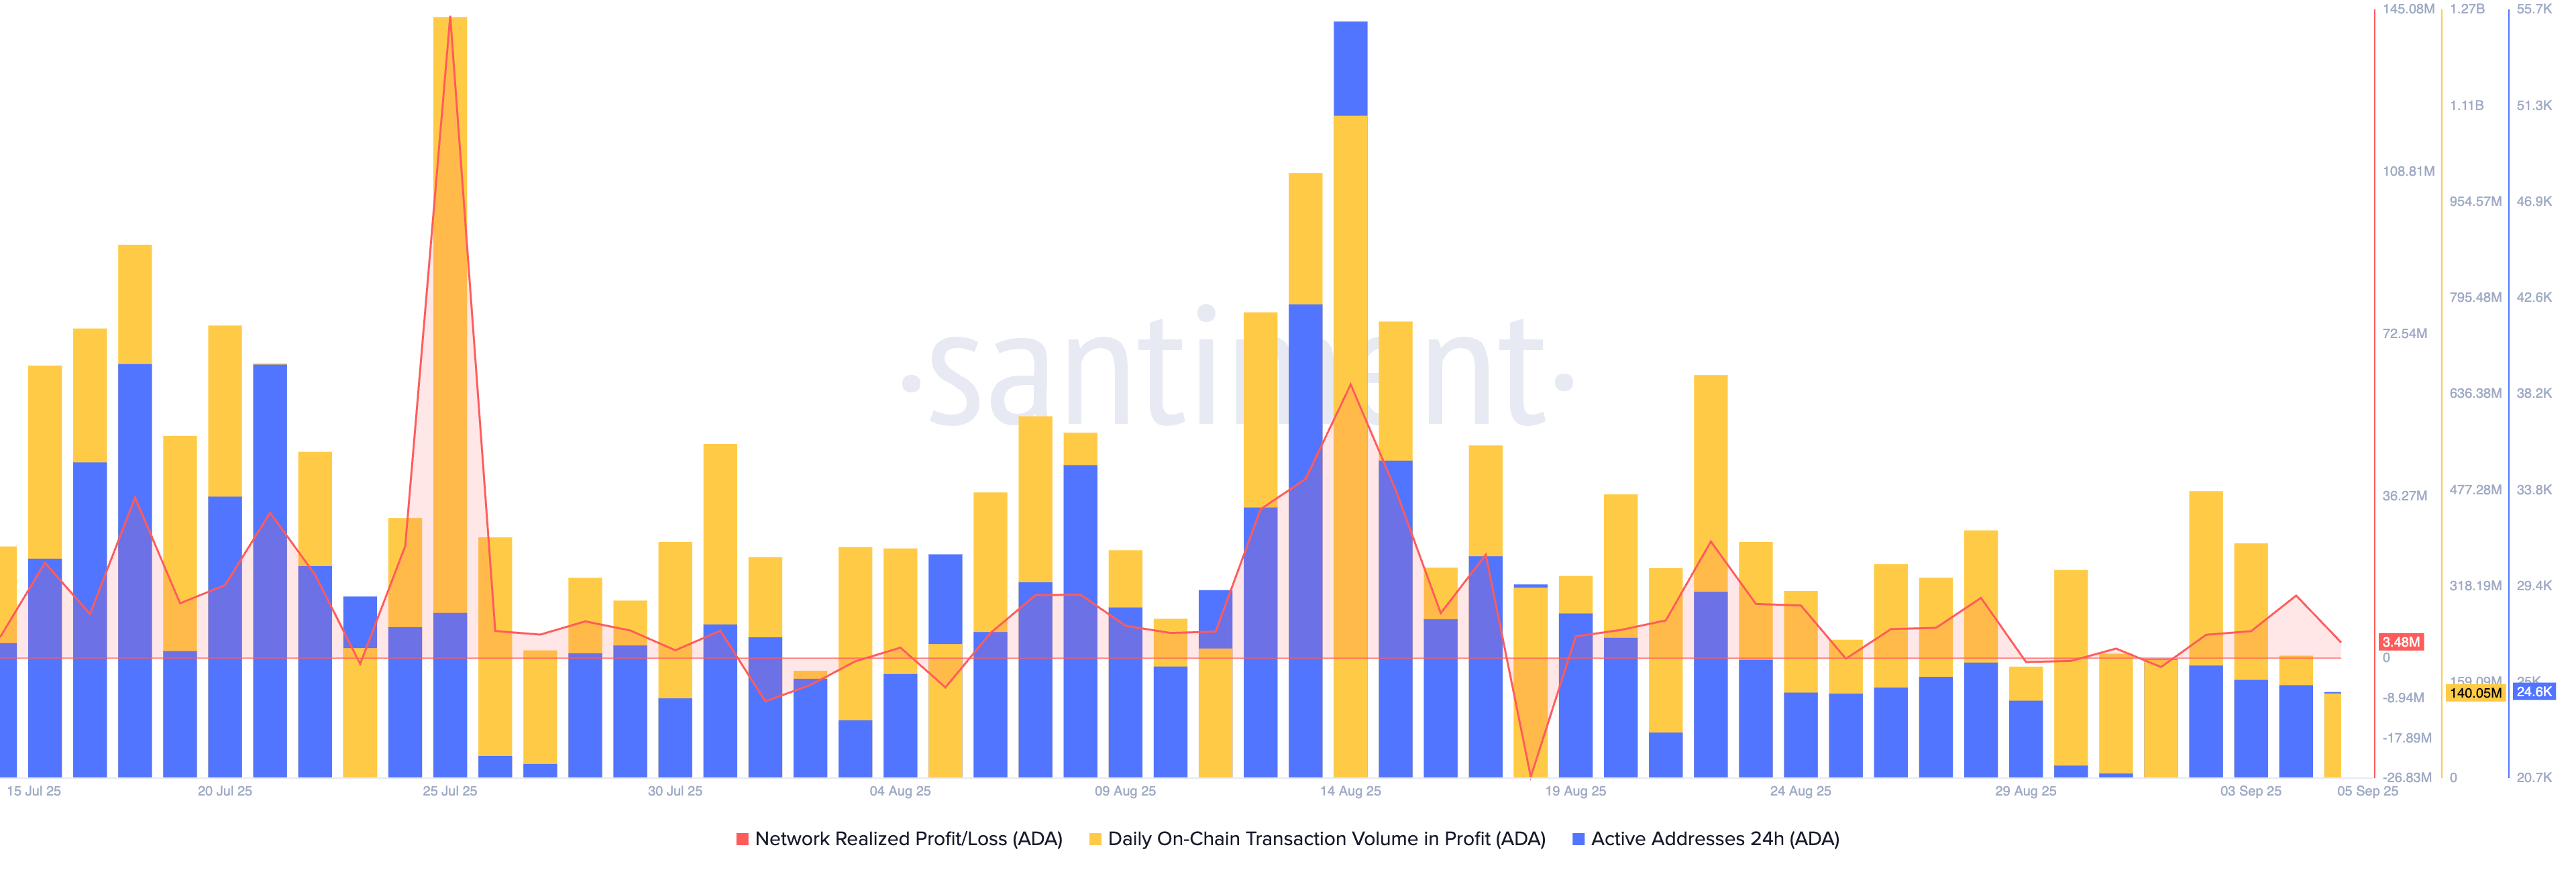
The Network Realized Profit/Loss (NRPL) is used to gauge the net amount of profit or loss realized by token holders after on-chain transactions. Santiment data shows Cardano’s NRPL stands at 3.48 million ADA, down from 13.98 million ADA on Thursday. This indicates a significant decline in the amount of profits booked by ADA holders, suggesting a drop in bullish momentum. 

Additionally, the number of active addresses on Cardano dropped to 24,455 on Friday, from 24,955 the previous day, indicating a decline in network activity. Cardano stands on thin ice as on-chain data points to fading bullish momentum and network activity.
Cardano nears a falling wedge pattern breakout

Cardano edges higher by over 2% on the day, challenging an overhead resistance trendline on the 4-hour chart, formed by connecting the highs of August 14 and August 25. This trendline completes a falling wedge pattern with a support trendline connected by the August 20 and September 1 lows. 

If Cardano marks a decisive close above the 200-period Exponential Moving Average (EMA) at $0.8335, it would confirm the falling wedge pattern breakout. The breakout rally in Cardano could target the R1 pivot level at $0.8913. 

Adding to the optimism, Cardano’s Open Interest (OI) holds above $1.570 billion, following the surge in mid-August. This indicates steady optimism among derivative traders. 
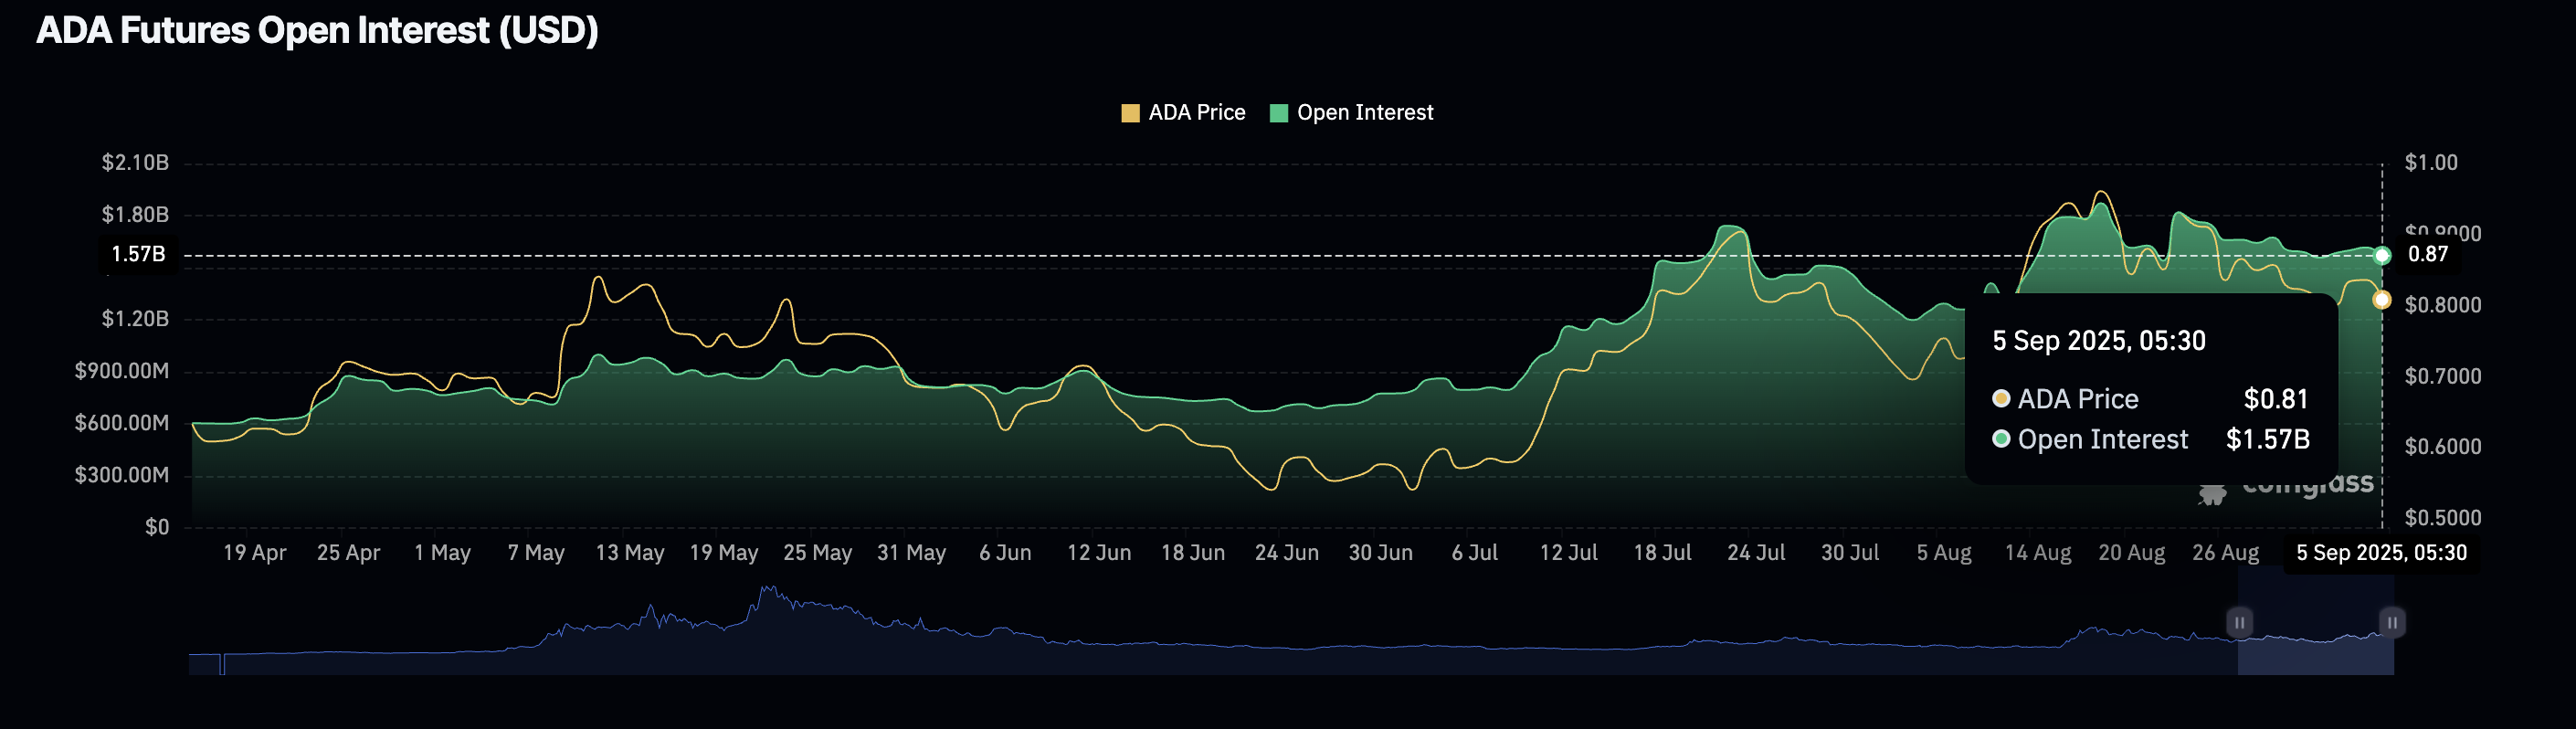
ADA Open Interest. Source: Coinglass

However, the technical indicators on the 4-hour chart flash mixed signals after the chaotic decline over the past few days. The Moving Average Convergence Divergence (MACD) approaches its signal line for a crossover, which would indicate a bullish shift, just a day after a bearish turnaround on Thursday. 

The Relative Strength Index (RSI) reads 52 on the same chart, surfacing above the halfway mark, which indicates a rise in buying pressure. Even so, the 50-period EMA shows a declining trend and has crossed under the 200-period EMA, signaling a Death Cross pattern. 
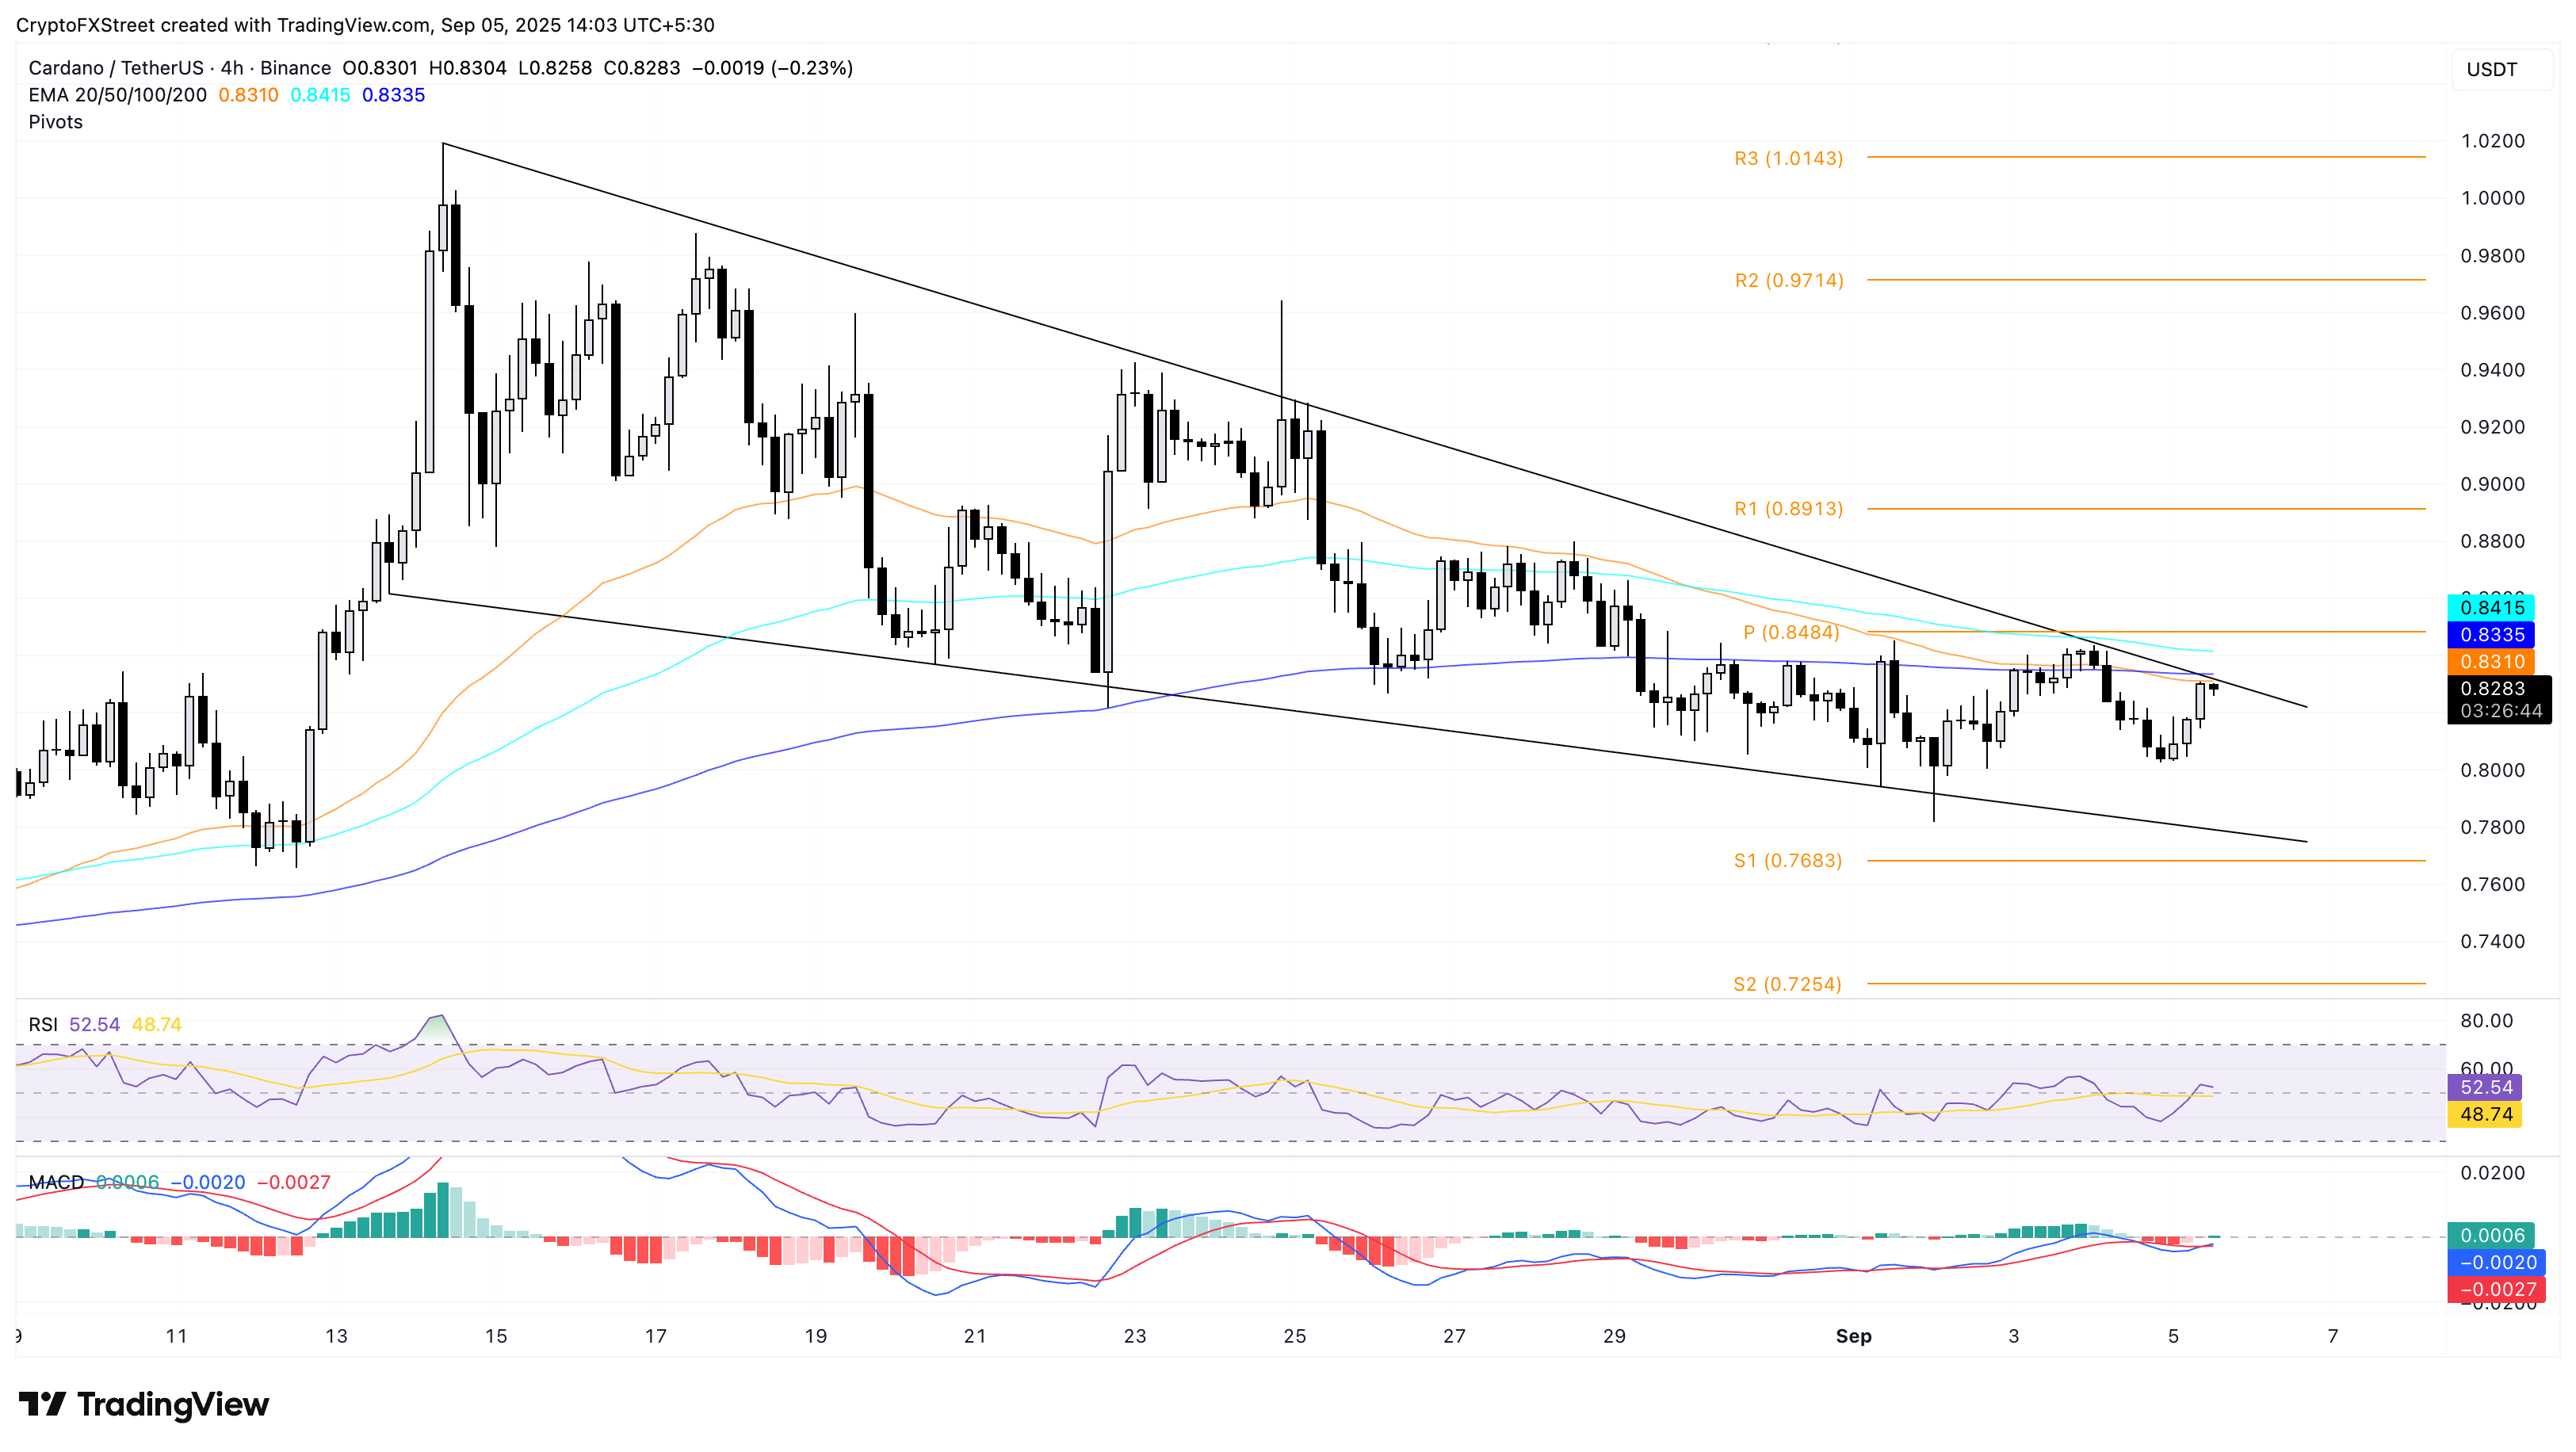
Looking down, a reversal from the 200-period EMA could result in a renewed downcycle within the falling wedge pattern. If so, ADA could extend the decline to the lower support trendline near $0.7788. 

Disclaimer: For information purposes only. Past performance is not indicative of future results.
placeholder
Japanese Yen rallies to February 18 high as upbeat wage data and GDP lift BoJ hike betsThe USD/JPY pair declines for the second straight day – also marking the fourth day of a fall in the previous five – and sinks to its lowest level since February 18, around mid-153.00s during the Asian session on Tuesday.
Author  FXStreet
Sep 08, Tue
The USD/JPY pair declines for the second straight day – also marking the fourth day of a fall in the previous five – and sinks to its lowest level since February 18, around mid-153.00s during the Asian session on Tuesday.
placeholder
Brent holds above $100 as tanker attacks tighten supply — but four forces are capping the rallyBrent crude is holding above $100 a barrel for a second session, its first close above the level since late July, as tanker attacks near the Strait of Hormuz squeeze an already tight physical market. Yet the rally has been gradual: 8.3 mb/d of Gulf output is still shut in, diesel is at a record, and forecasts now range from $74 to $100.
Author  Irene Q.
Sep 10, Thu
Brent crude is holding above $100 a barrel for a second session, its first close above the level since late July, as tanker attacks near the Strait of Hormuz squeeze an already tight physical market. Yet the rally has been gradual: 8.3 mb/d of Gulf output is still shut in, diesel is at a record, and forecasts now range from $74 to $100.
placeholder
US August CPI Preview: Will Inflation Reaccelerate? US Stocks, Dollar and Gold Face Key Test On Friday, September 11 (ET), the U.S. Bureau of Labor Statistics will release the Consumer Price Index (CPI) for August, the final major inflation report before the Federal Reserve's Sep
Author  TradingKey
Sep 10, Thu
On Friday, September 11 (ET), the U.S. Bureau of Labor Statistics will release the Consumer Price Index (CPI) for August, the final major inflation report before the Federal Reserve's Sep
placeholder
US August CPI lands tonight: after a 5.4% PPI shock, will the Fed hike on September 16?US August PPI came in at 5.4% year-on-year, above the 5.3% consensus, with core PPI at 4.6%. Traders have pushed the odds of a 25bp Fed hike on September 15-16 to around 70%. Tonight's CPI is the last major inflation print before the decision — here is the full calendar, the consensus numbers, and what a hot versus cool reading would mean for the dollar, yields, gold and stocks.
Author  Irene Q.
Sep 11, Fri
US August PPI came in at 5.4% year-on-year, above the 5.3% consensus, with core PPI at 4.6%. Traders have pushed the odds of a 25bp Fed hike on September 15-16 to around 70%. Tonight's CPI is the last major inflation print before the decision — here is the full calendar, the consensus numbers, and what a hot versus cool reading would mean for the dollar, yields, gold and stocks.
placeholder
Gold Price Forecast: PPI and Oil Prices Fuel Inflation Concerns, Can CPI Change Gold's Direction?As of the Asian session on September 11, gold prices (XAUUSD) remained in weak consolidation today after dropping sharply to near $4,300 on Thursday, with the latest price trading around
Author  TradingKey
Sep 11, Fri
As of the Asian session on September 11, gold prices (XAUUSD) remained in weak consolidation today after dropping sharply to near $4,300 on Thursday, with the latest price trading around
Related Instrument
goTop
quote