WLFI Flashes 2 Hidden Catalysts That Could Push Its Price to a New All-Time High

Source Beincrypto

WLFI (World Liberty Finance) officially launched on spot exchanges yesterday, and traders didn’t waste time testing its limits. After surging to an early all-time high near $0.35 on Spot exchanges, the token has since corrected sharply, losing more than 19% in the past 24 hours.

While parts of the market look bearish, a deeper look reveals one unlikely momentum driver that could push WLFI beyond its recent high.

Spot Market Shows Early Weakness

On-chain flows over the past 24 hours highlight why the spot market looks fragile for WLFI.

Top 100 addresses offloaded almost 216.54 million WLFI, worth close to $49.15 million at the average price of 0.227. Smart Money did pick up more than 102.78 million WLFI during the same period, almost $23.33 million in value. Public Figures, which include known KOLs and prominent market personalities, dumped close to $546.40 million.

WLFI Spot Market Experiences WeaknessWLFI Spot Market Experiences Weakness: Nansen

Whales holding between one and ten million tokens added 26.85 million WLFI, worth close to $6.10 million. While this accumulation looks large in percentage terms, it is inconsequential when compared to the scale of outflows from the Top 100 addresses and Public Figures.

Taken together, the spot market shows clear early weakness, with net selling pressure dominating. This makes it unlikely that buyers on the spot alone can drive WLFI higher in the near term. Instead, attention turns to the derivatives market, where liquidation maps and positioning hint at a very different story.

Want more token insights like this? Sign up for Editor Harsh Notariya’s Daily Crypto Newsletter here.

Derivatives Positioning Signals a Potential Trigger

If spot demand falters, derivatives often step in as the first unlikely short-term catalyst. WLFI’s perpetual contracts have been live since August 23, even before spot trading. That makes the derivative charts especially useful for early signals.

WLFI Liquidation Map (Hyperliquid)WLFI Liquidation Map (Hyperliquid): Coinglass

Across Binance, Bitget, and Hyperliquid, the picture is strikingly similar: short positions dominate. On Binance alone, shorts account for nearly double the long liquidations. At Bitget, short liquidations sit above $23 million, compared with just $16.6 million for longs. Hyperliquid’s seven-day liquidation map shows clusters near $0.28, a critical threshold.

WLFI Liquidation Map (Bitget)WLFI Liquidation Map (Bitget): Coinglass

This imbalance creates the conditions for a short squeeze — when rising prices force shorts to cover, accelerating the rally. If WLFI clears $0.28, those clusters could unwind quickly, potentially propelling the token toward $0.32, its previous swing high.

It is worth noting that if the WLFI price corrects, the token also becomes a long squeeze candidate, which would then invalidate the near-term bullish outlook. More about this in the price analysis segment.

WLFI Price Action and the Hidden Bullish Divergence

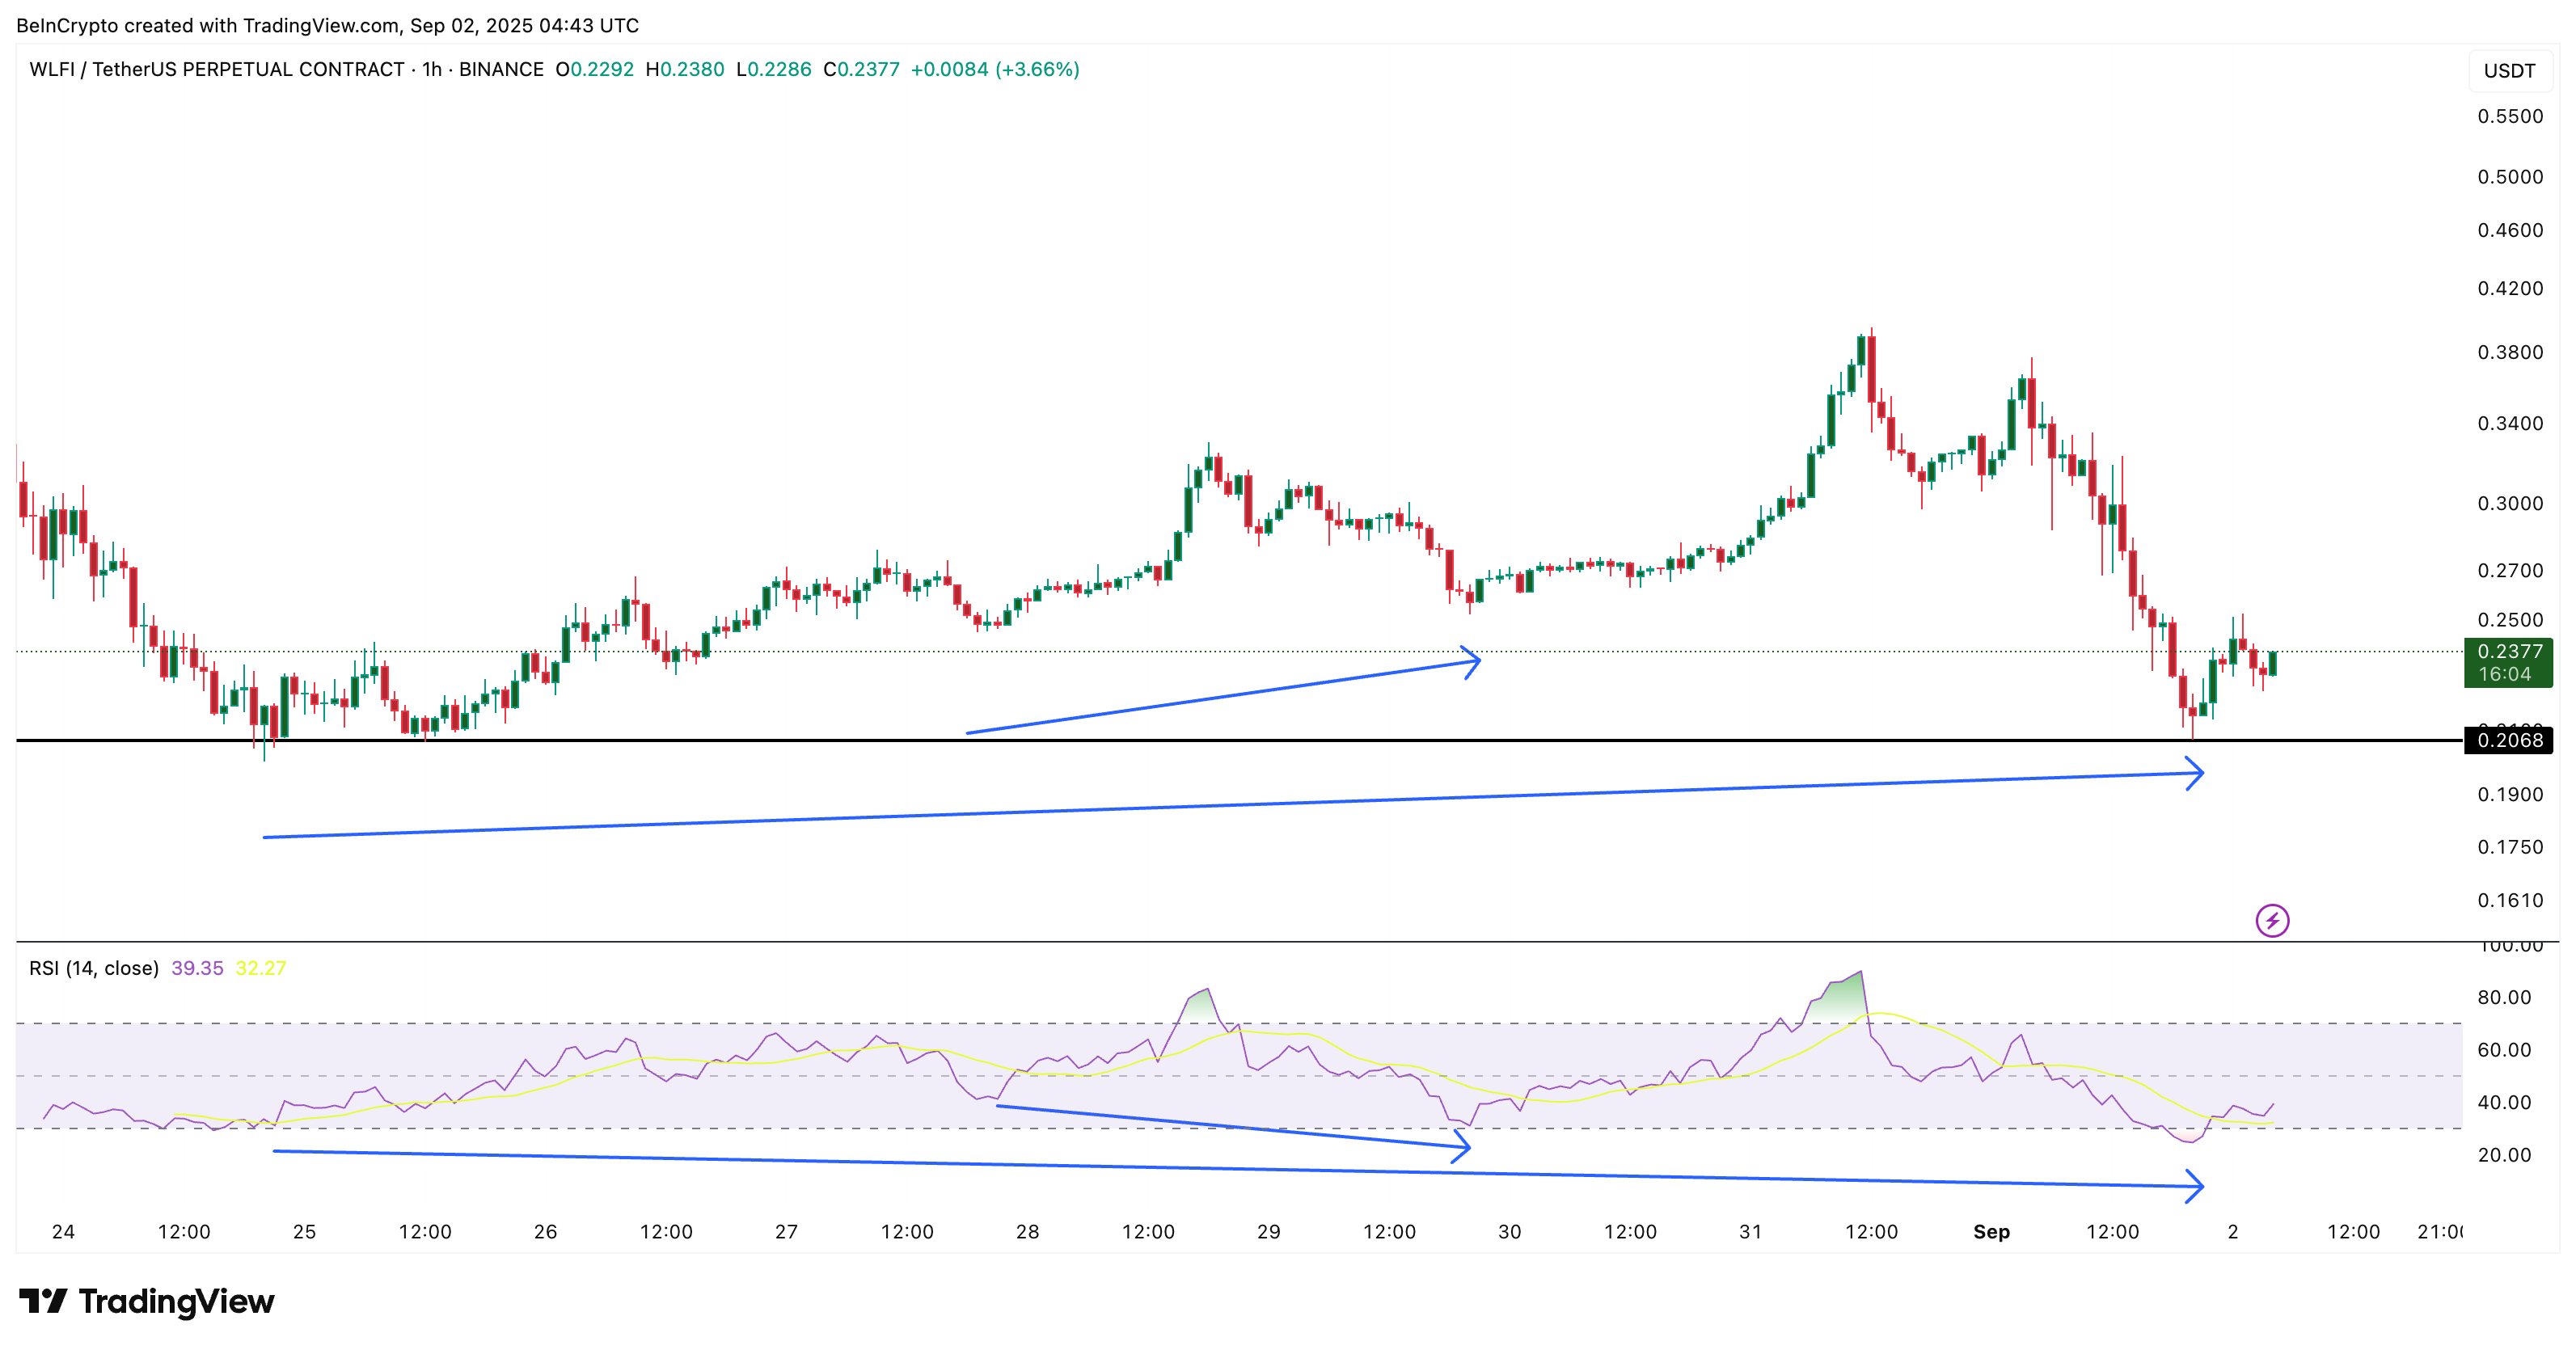
The perpetual chart offers important context for WLFI price. Between 27 and 29 August, the token showed a short-term setup where the WLFI price made a higher low while RSI printed a lower low. That divergence helped fuel the late-August rally.

Now, zooming out, a broader version of the same pattern has emerged. From August 24 to September 1, the WLFI price again formed higher lows, while RSI extended to fresh lower lows. This kind of divergence across a wider timeframe often signals that downside momentum is weakening despite the spot market, creating room for another upside attempt.

WLFI Price And DivergenceWLFI Price And Divergence: TradingView

WLFI’s perpetual contracts went live on August 23, 2025, ahead of the token’s spot listings across exchanges. At launch, they operated under a capped price mechanism, meaning trading was constrained within a set range until an official spot index became available.

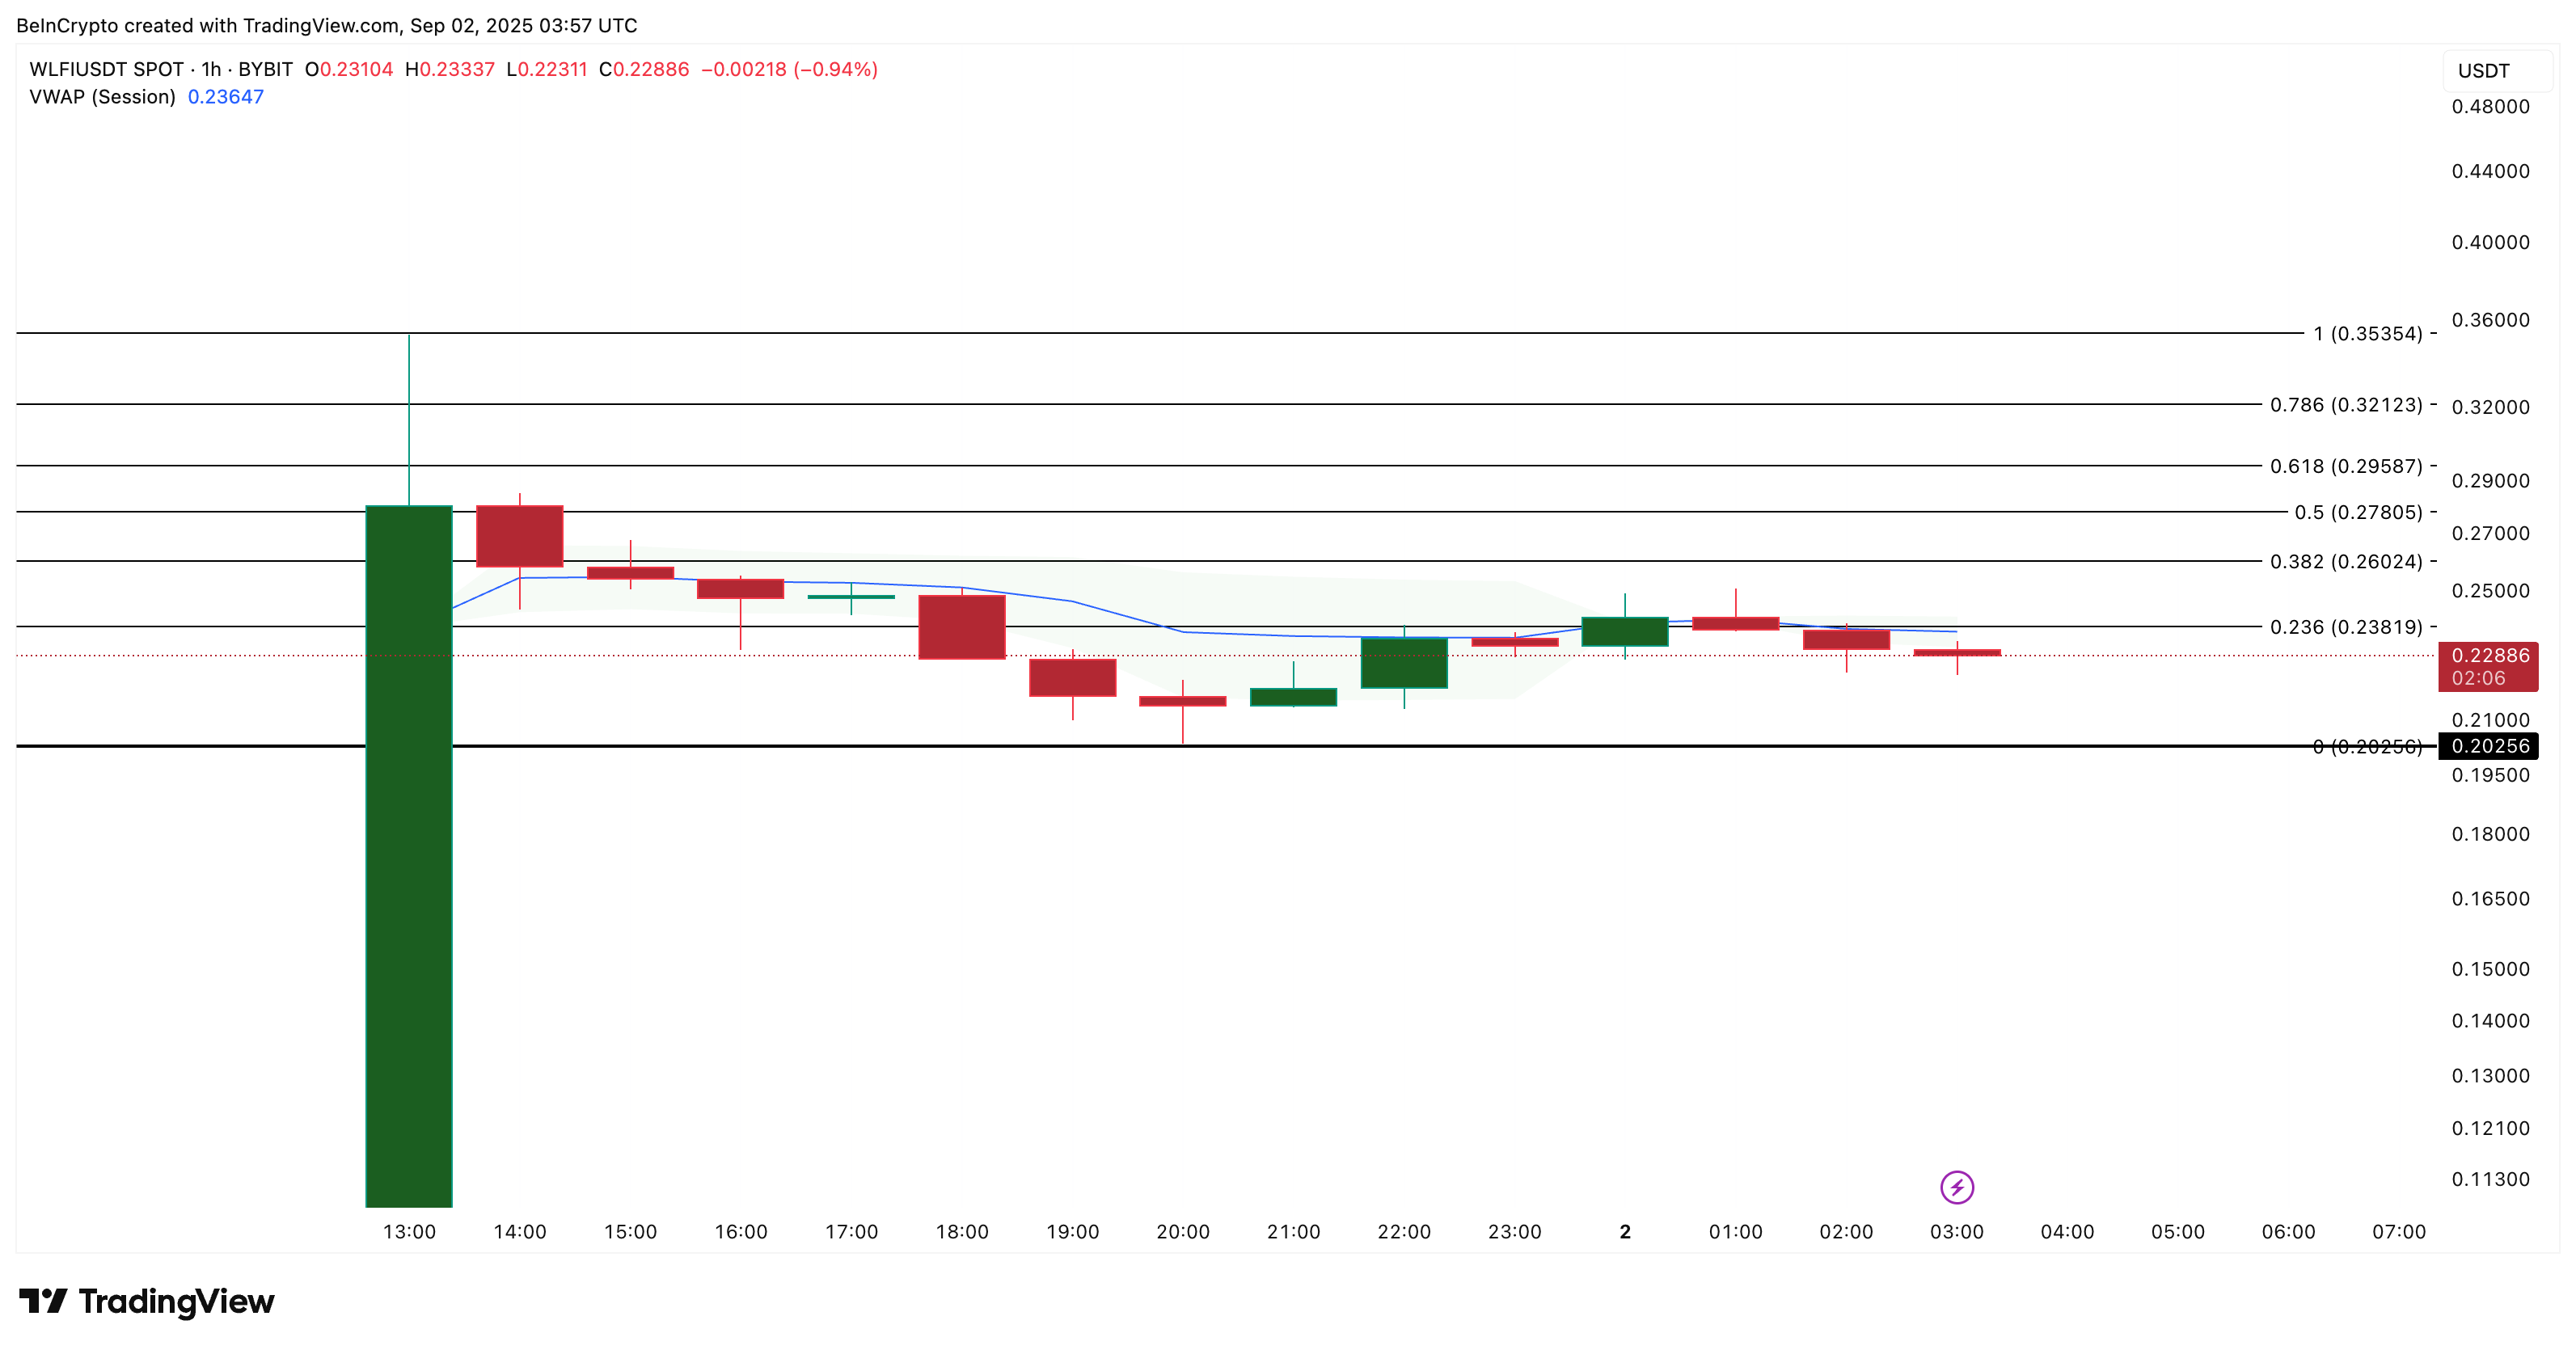
On the Bybit spot chart (1-hour), WLFI trades just under the VWAP (Volume-Weighted Average Price) line near $0.23. VWAP tracks the average price weighted by volume and is often treated by traders as dynamic support or resistance. WLFI has already attempted to cross VWAP but failed, making it a near-term hurdle.

WLFI Price AnalysisWLFI Price Analysis: TradingView

A decisive move above $0.23 would align technical momentum with derivatives positioning.

If that alignment holds, the domino effect is clear: breaching $0.29 could liquidate shorts, $0.32 would retest the high, and beyond that, the WLFI price would enter price discovery, opening the door to a new all-time high.

However, a dip under $0.20 would bring in long liquidations in play, defeating the near-term bullish outlook and pushing the price into the untested downside territory.

Disclaimer: For information purposes only. Past performance is not indicative of future results.
placeholder
Gold Price Forecast: XAU/USD drifts higher above $4,200 as Fed delivers expected cutGold price (XAU/USD) gains momentum to around $4,235 during the early Asian session on Thursday. The precious metal extends its upside after the US Federal Reserve (Fed) delivered an expected third consecutive interest rate cut and maintained its outlook for just one cut in 2026.
Author  FXStreet
Dec 11, Thu
Gold price (XAU/USD) gains momentum to around $4,235 during the early Asian session on Thursday. The precious metal extends its upside after the US Federal Reserve (Fed) delivered an expected third consecutive interest rate cut and maintained its outlook for just one cut in 2026.
placeholder
Gold remains bid as lack of Fed clarity and geopolitical frictions persistGold (XAU/USD) advances modestly on Friday as traders seem to book profits ahead of the weekend, yet clings to gains of over 0.51% after reaching a seven-week high of $4,353. At the time of writing, XAU/USD trades at $4,302 as traders digest comments from Federal Reserve (Fed) officials.
Author  FXStreet
Yesterday 01: 34
Gold (XAU/USD) advances modestly on Friday as traders seem to book profits ahead of the weekend, yet clings to gains of over 0.51% after reaching a seven-week high of $4,353. At the time of writing, XAU/USD trades at $4,302 as traders digest comments from Federal Reserve (Fed) officials.
placeholder
Ethereum Price Slips Lower — $3,000 Looms as the Key BattlegroundEthereum is attempting to recover from a $3,026 low but remains below $3,200 and the 100-hour SMA, with a bearish trend line near $3,175 capping rebounds as bulls need a clean break above $3,200 to target $3,250–$3,400, while a drop below $3,050 risks a retest of $3,000 and $2,940.
Author  Mitrade
Yesterday 03: 25
Ethereum is attempting to recover from a $3,026 low but remains below $3,200 and the 100-hour SMA, with a bearish trend line near $3,175 capping rebounds as bulls need a clean break above $3,200 to target $3,250–$3,400, while a drop below $3,050 risks a retest of $3,000 and $2,940.
placeholder
Macro Analysts: Hawkish Japan Could Push Bitcoin Below $70KAnalysts predict Bitcoin may face further declines towards the $70,000 mark if the Bank of Japan raises interest rates as expected.
Author  Mitrade
Yesterday 05: 48
Analysts predict Bitcoin may face further declines towards the $70,000 mark if the Bank of Japan raises interest rates as expected.
placeholder
Bitcoin Slides 5% as Sellers Lean In — Can BTC Reclaim $88,000?Bitcoin has dropped back below $88,000 after rolling over from $90,500, with price still trading under the 100-hour Simple Moving Average. The sell-off found a floor at $85,151, and BTC is now consolidating near that base, but rebounds are facing pressure from a bearish trend line around $89,000. Bulls need to retake $88,000–$89,000 to ease downside risk; failure to do so keeps $85,500–$85,000 and then $83,500 in play, with $80,000 as the deeper “line in the sand.” Bitcoin (BTC) is back in damage-control mode after a sharp pullback wiped out recent gains. The price failed to reclaim the $90,000–$90,500 band, rolled over, and slid through $88,500 before briefly dipping under $87,000. Buyers did show up around $85,000, but the rebound so far looks more like stabilization than a clear trend reversal. Bitcoin dips hard, finds a bid near $85,000(h3) BTC’s latest move lower began when it couldn’t build follow-through above $90,000 and $90,500. Once that upside stalled, sellers took control and pushed price down through $88,500. The slide accelerated enough to spike below $87,000, but the market didn’t free-fall. Bulls defended the $85,000 zone, printing a low at $85,151. Since then, Bitcoin has been consolidating below the 23.6% Fibonacci retracement of the drop from the $93,560 swing high to the $85,151 low — a clue that the bounce is still shallow and that sellers haven’t fully backed off yet. Structurally, BTC is still on the back foot: It’s trading below $88,000, and It remains below the 100-hour Simple Moving Average, keeping short-term trend pressure pointed downward. Resistance is layered, and $89,000 is the problem area(h3) If bulls try to turn this into a recovery, they’ll have to climb through multiple ceilings in quick succession. First, BTC faces resistance around $87,150, followed by a more meaningful barrier near $87,500. From there, the market’s attention snaps back to $88,000 — the level BTC just lost and now needs to reclaim. A close back above $88,000 would improve the tone, but it doesn’t solve the bigger issue: there’s a bearish trend line on the hourly BTC/USD chart (Kraken feed) with resistance near $89,000, which also lines up with the next technical hurdle. If BTC can push through $89,000 and hold, the rebound could extend toward $90,000, with follow-through targets at $91,000 and $91,500. But until price clears that $88,000–$89,000 zone, rallies are at risk of being sold rather than chased. If BTC fails to reclaim resistance, the downside path is clear(h3) The near-term bear case is simple: if Bitcoin can’t climb back above the $87,000 area and keep traction, sellers may attempt another leg lower. Support levels line up like this: Immediate support: $85,500 First major support: $85,000 Next support: $83,500 Then $82,500 in the near term Below that, the major “don’t break this” level is still $80,000. If BTC slips under $80,000, the risk of acceleration to the downside increases significantly — not because it’s magic, but because it’s the kind of psychological and structural level that tends to trigger forced de-risking. Indicators: momentum still leans bearish(h3) The intraday indicators aren’t offering much comfort yet: Hourly MACD is losing pace in the bearish zone. Hourly RSI remains below 50, suggesting sellers still have the upper hand on short timeframes. So while the $85,000 defense held for now, the market hasn’t flipped bullish — it’s just stopped bleeding.
Author  Mitrade
3 hours ago
Bitcoin has dropped back below $88,000 after rolling over from $90,500, with price still trading under the 100-hour Simple Moving Average. The sell-off found a floor at $85,151, and BTC is now consolidating near that base, but rebounds are facing pressure from a bearish trend line around $89,000. Bulls need to retake $88,000–$89,000 to ease downside risk; failure to do so keeps $85,500–$85,000 and then $83,500 in play, with $80,000 as the deeper “line in the sand.” Bitcoin (BTC) is back in damage-control mode after a sharp pullback wiped out recent gains. The price failed to reclaim the $90,000–$90,500 band, rolled over, and slid through $88,500 before briefly dipping under $87,000. Buyers did show up around $85,000, but the rebound so far looks more like stabilization than a clear trend reversal. Bitcoin dips hard, finds a bid near $85,000(h3) BTC’s latest move lower began when it couldn’t build follow-through above $90,000 and $90,500. Once that upside stalled, sellers took control and pushed price down through $88,500. The slide accelerated enough to spike below $87,000, but the market didn’t free-fall. Bulls defended the $85,000 zone, printing a low at $85,151. Since then, Bitcoin has been consolidating below the 23.6% Fibonacci retracement of the drop from the $93,560 swing high to the $85,151 low — a clue that the bounce is still shallow and that sellers haven’t fully backed off yet. Structurally, BTC is still on the back foot: It’s trading below $88,000, and It remains below the 100-hour Simple Moving Average, keeping short-term trend pressure pointed downward. Resistance is layered, and $89,000 is the problem area(h3) If bulls try to turn this into a recovery, they’ll have to climb through multiple ceilings in quick succession. First, BTC faces resistance around $87,150, followed by a more meaningful barrier near $87,500. From there, the market’s attention snaps back to $88,000 — the level BTC just lost and now needs to reclaim. A close back above $88,000 would improve the tone, but it doesn’t solve the bigger issue: there’s a bearish trend line on the hourly BTC/USD chart (Kraken feed) with resistance near $89,000, which also lines up with the next technical hurdle. If BTC can push through $89,000 and hold, the rebound could extend toward $90,000, with follow-through targets at $91,000 and $91,500. But until price clears that $88,000–$89,000 zone, rallies are at risk of being sold rather than chased. If BTC fails to reclaim resistance, the downside path is clear(h3) The near-term bear case is simple: if Bitcoin can’t climb back above the $87,000 area and keep traction, sellers may attempt another leg lower. Support levels line up like this: Immediate support: $85,500 First major support: $85,000 Next support: $83,500 Then $82,500 in the near term Below that, the major “don’t break this” level is still $80,000. If BTC slips under $80,000, the risk of acceleration to the downside increases significantly — not because it’s magic, but because it’s the kind of psychological and structural level that tends to trigger forced de-risking. Indicators: momentum still leans bearish(h3) The intraday indicators aren’t offering much comfort yet: Hourly MACD is losing pace in the bearish zone. Hourly RSI remains below 50, suggesting sellers still have the upper hand on short timeframes. So while the $85,000 defense held for now, the market hasn’t flipped bullish — it’s just stopped bleeding.
goTop
quote