

Bitcoin Price Struggles to Rebound – Signs of a Bigger Crash Ahead?

Source Newsbtc

Bitcoin price is showing bearish signs below $113,000. BTC is struggling to recover and might start another decline below the $110,500 zone.

  • Bitcoin started a recovery wave from the $108,750 zone.
  • The price is trading below $112,500 and the 100 hourly Simple moving average.
  • There was a break above a key bearish trend line with resistance at $111,350 on the hourly chart of the BTC/USD pair (data feed from Kraken).
  • The pair might start another increase if it clears the $113,000 resistance zone.

Bitcoin Price Attempts Fresh Increase

Bitcoin price extended losses after close below the $112,000 level. BTC gained bearish momentum and traded below the $111,500 support zone.

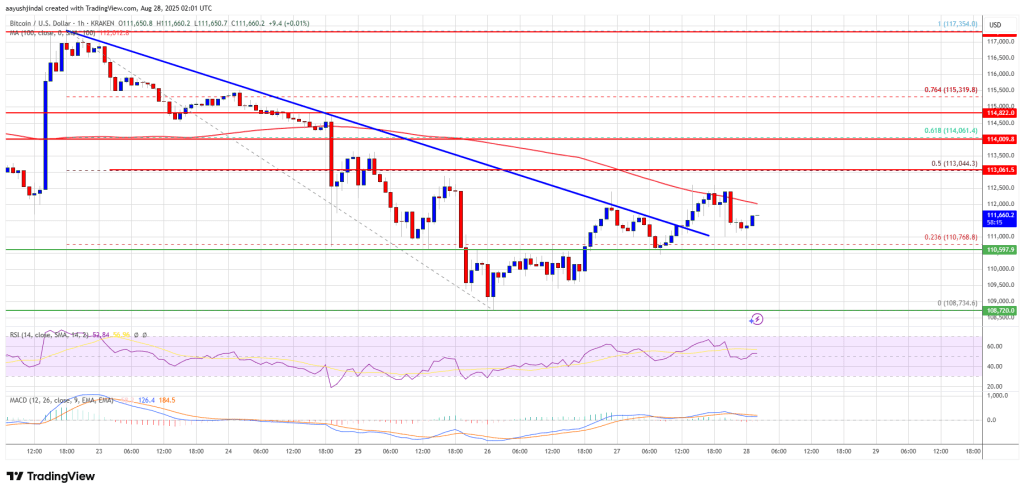
There was a move below the $110,500 support zone and the 100 hourly Simple moving average. The pair tested the $108,750 zone. A low was formed at $108,734 and the price recently started a recovery wave. There was a move above the $112,000 level.

The price surpassed the 23.6% Fib retracement level of the key drop from the $117,354 swing high to the $110,734 low. Besides, there was a break above a key bearish trend line with resistance at $111,350 on the hourly chart of the BTC/USD pair.

Bitcoin is now trading below $112,500 and the 100 hourly Simple moving average. Immediate resistance on the upside is near the $112,500 level. The first key resistance is near the $113,000 level or the 50% Fib retracement level of the key drop from the $117,354 swing high to the $110,734 low. The next resistance could be $114,000.
Bitcoin Price

A close above the $114,000 resistance might send the price further higher. In the stated case, the price could rise and test the $115,000 resistance level. Any more gains might send the price toward the $115,500 level. The main target could be $116,500.

Another Decline In BTC?

If Bitcoin fails to rise above the $113,000 resistance zone, it could start a fresh decline. Immediate support is near the $110,600 level. The first major support is near the $109,500 level.

The next support is now near the $108,750 zone. Any more losses might send the price toward the $107,100 support in the near term. The main support sits at $105,500, below which BTC might accelerate lower.

Technical indicators:

Hourly MACD – The MACD is now losing pace in the bearish zone.

Hourly RSI (Relative Strength Index) – The RSI for BTC/USD is now below the 50 level.

Major Support Levels – $110,600, followed by $109,500.

Major Resistance Levels – $112,500 and $113,000.

Disclaimer: For information purposes only. Past performance is not indicative of future results.
placeholder
Silver Price Forecast: XAG/USD falls like house of cards on Fed’s hawkish narrativeSilver price (XAG/USD) is down 4.3% to near $61.50 during the European trading session on Monday. The white metal nosedives as elevated United States (US) Treasury Yields have diminished its appeal.
Author  FXStreet
9 hours ago
Silver price (XAG/USD) is down 4.3% to near $61.50 during the European trading session on Monday. The white metal nosedives as elevated United States (US) Treasury Yields have diminished its appeal.
placeholder
Gold Falls Below $4,200 in Single-Day Drop of Over $100: Why Are Gold Prices Plunging? As of the Asian session on September 28, international gold prices continued their recent weakness, with spot gold (XAUUSD) falling below $4,200 intraday to a low of $4,179.42, down over
Author  TradingKey
9 hours ago
As of the Asian session on September 28, international gold prices continued their recent weakness, with spot gold (XAUUSD) falling below $4,200 intraday to a low of $4,179.42, down over
placeholder
Four jobs reports in five days: what JOLTS, ADP, claims and the September payrolls mean for the October Fed decisionThe US labour market faces its densest data week of the month. JOLTS job openings land Tuesday (7.2 million expected), ADP on Wednesday (70,000 expected), initial claims on Thursday and the September non-farm payrolls on Friday (100,000 expected, down from 162,000). Markets price a 64%-70% chance of another quarter-point Fed hike on October 28. The dollar index sits at 100.77 and the S&P 500 at 7,729.8.
Author  Mitrade
12 hours ago
The US labour market faces its densest data week of the month. JOLTS job openings land Tuesday (7.2 million expected), ADP on Wednesday (70,000 expected), initial claims on Thursday and the September non-farm payrolls on Friday (100,000 expected, down from 162,000). Markets price a 64%-70% chance of another quarter-point Fed hike on October 28. The dollar index sits at 100.77 and the S&P 500 at 7,729.8.
placeholder
Brent edges toward $99 as Trump rejects Iran's Hormuz proposal — why the war-risk premium won't rebuildBrent crude rose 0.92% to $98.51 and WTI gained 1.15% to $93.51 after President Trump rejected Iran's seven-day proposal to reopen the Strait of Hormuz. But both benchmarks remain about 12% below their early-September highs, because supply never actually stopped. Hormuz flows ran at 33.7 million barrels this week, in line with the prior week, and Saudi Arabia's East-West pipeline restarted on September 22.
Author  Suzie
12 hours ago
Brent crude rose 0.92% to $98.51 and WTI gained 1.15% to $93.51 after President Trump rejected Iran's seven-day proposal to reopen the Strait of Hormuz. But both benchmarks remain about 12% below their early-September highs, because supply never actually stopped. Hormuz flows ran at 33.7 million barrels this week, in line with the prior week, and Saudi Arabia's East-West pipeline restarted on September 22.
placeholder
Middle East War updates: Trump says he expects renewed Iran talks this weekHere’s a brief recap of the key developments in the Middle East war that occurred over the weekend, which are expected to have a significant impact on markets in the upcoming week.
Author  FXStreet
17 hours ago
Here’s a brief recap of the key developments in the Middle East war that occurred over the weekend, which are expected to have a significant impact on markets in the upcoming week.
goTop
quote