

Dogecoin (DOGE) Slips Into Red Zone, Is a Bigger Crash Looming?

Source Newsbtc

Dogecoin started a fresh decline below the $0.2320 zone against the US Dollar. DOGE is now consolidating and might dip further below $0.210.

  • DOGE price started a fresh decline below the $0.2250 level.
  • The price is trading below the $0.2250 level and the 100-hourly simple moving average.
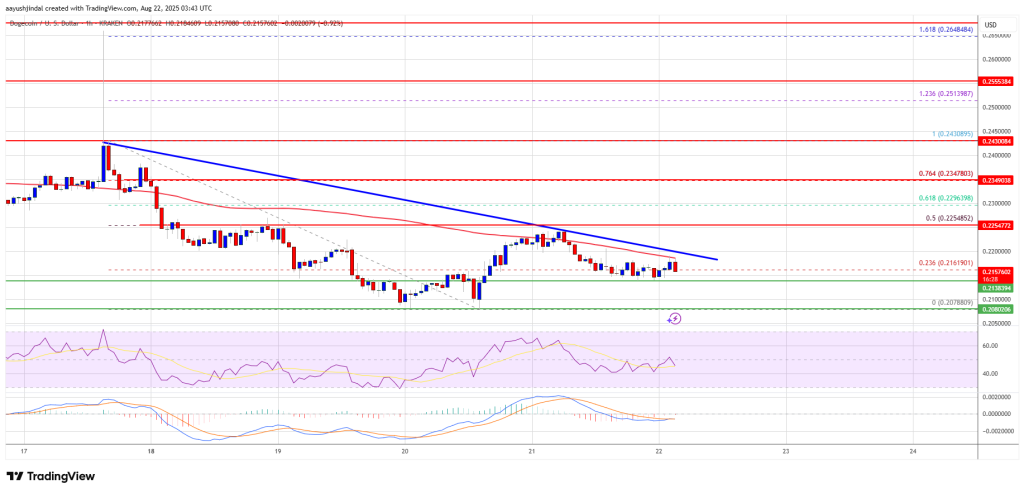
  • There is a bearish trend line forming with resistance at $0.220 on the hourly chart of the DOGE/USD pair (data source from Kraken).
  • The price could start a fresh upward move if it stays above the $0.2080 zone.

Dogecoin Price Dips Further

Dogecoin price started a fresh decline after there was a close below $0.240, like Bitcoin and Ethereum. DOGE declined below the $0.2320 and $0.2250 support levels.

The price even traded below $0.2120. A low was formed at $0.2078 and the price is now consolidating losses. There was a minor recovery wave above the 23.6% Fib retracement level of the recent decline from the $0.2430 swing high to the $0.2078 low.

Dogecoin price is now trading below the $0.2250 level and the 100-hourly simple moving average. If there is a recovery wave, immediate resistance on the upside is near the $0.220 level. There is also a bearish trend line forming with resistance at $0.220 on the hourly chart of the DOGE/USD pair.

The first major resistance for the bulls could be near the $0.2250 level. It is close to the 50% Fib retracement level of the recent decline from the $0.2430 swing high to the $0.2078 low.
Dogecoin Price

The next major resistance is near the $0.2320 level. A close above the $0.2320 resistance might send the price toward the $0.2450 resistance. Any more gains might send the price toward the $0.250 level. The next major stop for the bulls might be $0.2550.

Another Decline In DOGE?

If DOGE’s price fails to climb above the $0.2250 level, it could continue to move down. Initial support on the downside is near the $0.2120 level. The next major support is near the $0.2080 level.

The main support sits at $0.2050. If there is a downside break below the $0.2050 support, the price could decline further. In the stated case, the price might decline toward the $0.20 level or even $0.1920 in the near term.

Technical Indicators

Hourly MACD – The MACD for DOGE/USD is now gaining momentum in the bearish zone.

Hourly RSI (Relative Strength Index) – The RSI for DOGE/USD is now below the 50 level.

Major Support Levels – $0.2120 and $0.2050.

Major Resistance Levels – $0.2250 and $0.2320.

Disclaimer: For information purposes only. Past performance is not indicative of future results.
placeholder
Dollar presses 102 as the 10-year yield sits at 5.14% — and October hike odds are only 17%The dollar index closed at 101.99 (+0.20%) on Monday after briefly topping 102.07, while the 10-year Treasury yield rose to 5.14% and the 2-year hit 4.774% — yet futures price only about a 17% chance of a hike at the October 27-28 FOMC, versus roughly 90% for December. The driver is a global bond selloff, not a Fed repricing: France's 10-year OAT jumped to 4.84% ~ 4.94% and the OAT-Bund spread widened to 140 ~ 146bp. Here are the levels, the cross-asset read-through and what to watch.
Author  Irene Q.
Oct 20, Tue
The dollar index closed at 101.99 (+0.20%) on Monday after briefly topping 102.07, while the 10-year Treasury yield rose to 5.14% and the 2-year hit 4.774% — yet futures price only about a 17% chance of a hike at the October 27-28 FOMC, versus roughly 90% for December. The driver is a global bond selloff, not a Fed repricing: France's 10-year OAT jumped to 4.84% ~ 4.94% and the OAT-Bund spread widened to 140 ~ 146bp. Here are the levels, the cross-asset read-through and what to watch.
placeholder
The Fed will sit still on October 28 — but 100 of 100 economists now expect a December hikeA Reuters poll run October 16-20 found 94 of 100 economists expecting the Fed to hold at 3.75-4.00% on October 28 — and all 100 expecting a hike in December, against less than half a month earlier. The market is close to the same price, with CME FedWatch at roughly 17% for October and 82.8% for December. With the Fed in blackout since October 17, here are the five dates that decide the rest of the year, what each one is priced for, and the two directions each can take.
Author  Irene Q.
Oct 22, Thu
A Reuters poll run October 16-20 found 94 of 100 economists expecting the Fed to hold at 3.75-4.00% on October 28 — and all 100 expecting a hike in December, against less than half a month earlier. The market is close to the same price, with CME FedWatch at roughly 17% for October and 82.8% for December. With the Fed in blackout since October 17, here are the five dates that decide the rest of the year, what each one is priced for, and the two directions each can take.
placeholder
Gold Price Analysis Today | Forex Gold Analysis | XAU/USD Analysis - October 23, 2026Get the latest gold price analysis, forex gold insights, and XAU/USD analysis for October 23, 2026. Read on for the details.
Author  Mitrade
Oct 23, Fri
Get the latest gold price analysis, forex gold insights, and XAU/USD analysis for October 23, 2026. Read on for the details.
placeholder
Nasdaq closes at 26,008.86 — 8.9 points above 26,000, and the credit market never blinkedThe Nasdaq Composite fell 2.60% to 26,008.86 on October 22, its worst session since June, as Meta sank 6.98% on 2026 capex guidance of $135–145 billion. But the equal-weight S&P 500 rose 0.73%, high-yield credit was flat and 10-year yields fell 20 basis points. This was an AI de-rating, not a risk-off event — here is the transmission chain, the 29,000 / 28,200 levels and what would prove it wrong.
Author  Irene Q.
Oct 23, Fri
The Nasdaq Composite fell 2.60% to 26,008.86 on October 22, its worst session since June, as Meta sank 6.98% on 2026 capex guidance of $135–145 billion. But the equal-weight S&P 500 rose 0.73%, high-yield credit was flat and 10-year yields fell 20 basis points. This was an AI de-rating, not a risk-off event — here is the transmission chain, the 29,000 / 28,200 levels and what would prove it wrong.
placeholder
Brent tops $113 on Saudi supply risk — but the diesel line in the EIA report is the tellBrent's December contract settled at $113.17 on October 22, up 4.00% and the highest close since May 4, after Saudi Arabia restricted refined-product shipments. The same session's EIA report showed crude stocks down 3.06 million barrels and gasoline down 2.95 million — but distillates built 1.68 million. That single line decides whether $113 holds: here are the data, the 108.8 / 114.0 / 119.3 levels and the two scenarios.
Author  Irene Q.
Oct 23, Fri
Brent's December contract settled at $113.17 on October 22, up 4.00% and the highest close since May 4, after Saudi Arabia restricted refined-product shipments. The same session's EIA report showed crude stocks down 3.06 million barrels and gasoline down 2.95 million — but distillates built 1.68 million. That single line decides whether $113 holds: here are the data, the 108.8 / 114.0 / 119.3 levels and the two scenarios.
goTop
quote