


Bitcoin shows weakness in 2025 amid its decoupling from Gold and the US Dollar's steep decline
- Bitcoin is down over 6% in 2025 despite the US Dollar sustaining a YTD loss of 9%.
- The top crypto and Gold have historically rallied during periods of Dollar weakness, with BTC posting average gains of 43%.
- The EXY has also reversed its losses since January at the expense of Bitcoin, US stocks and the DXY.
- BTC's historical correlation with Gold has weakened due to its growing similarity with stocks amid global trade war tensions.
Bitcoin (BTC) climbed above $88,000 on Monday, the first time since the beginning of April after a week-long consolidation. However, the top crypto has declined over 6% year-to-date (YTD) despite a 9% plunge in the US Dollar Index (DXY) — which historically triggered moderate gains for BTC. Meanwhile, Bitcoin has shown signs of decoupling from Gold due to its rising similarity with US stocks over the past year.
Bitcoin correlations altered as USD declines and Gold sees more traction
Despite breaking the $100,000 threshold and setting a new all-time high (ATH) above $108,000, Bitcoin has seen a setback in 2025, suffering a 6% decline since the beginning of the year. The main cause of Bitcoin's decline so far is traced to recent economic uncertainties in the US, particularly with President Trump’s tariffs kickstarting a global trade war.
BTC's weak performance follows a decline in the DXY, which has dropped 9% year-to-date. Historically, the top crypto and the DXY have shown inverse correlation, as a drop in the index often leads to a rise in Bitcoin, according to Binance Research. Since 2011, Bitcoin has recorded average returns of 43% during sharp DXY declines of ≥5% over a 3-month period.
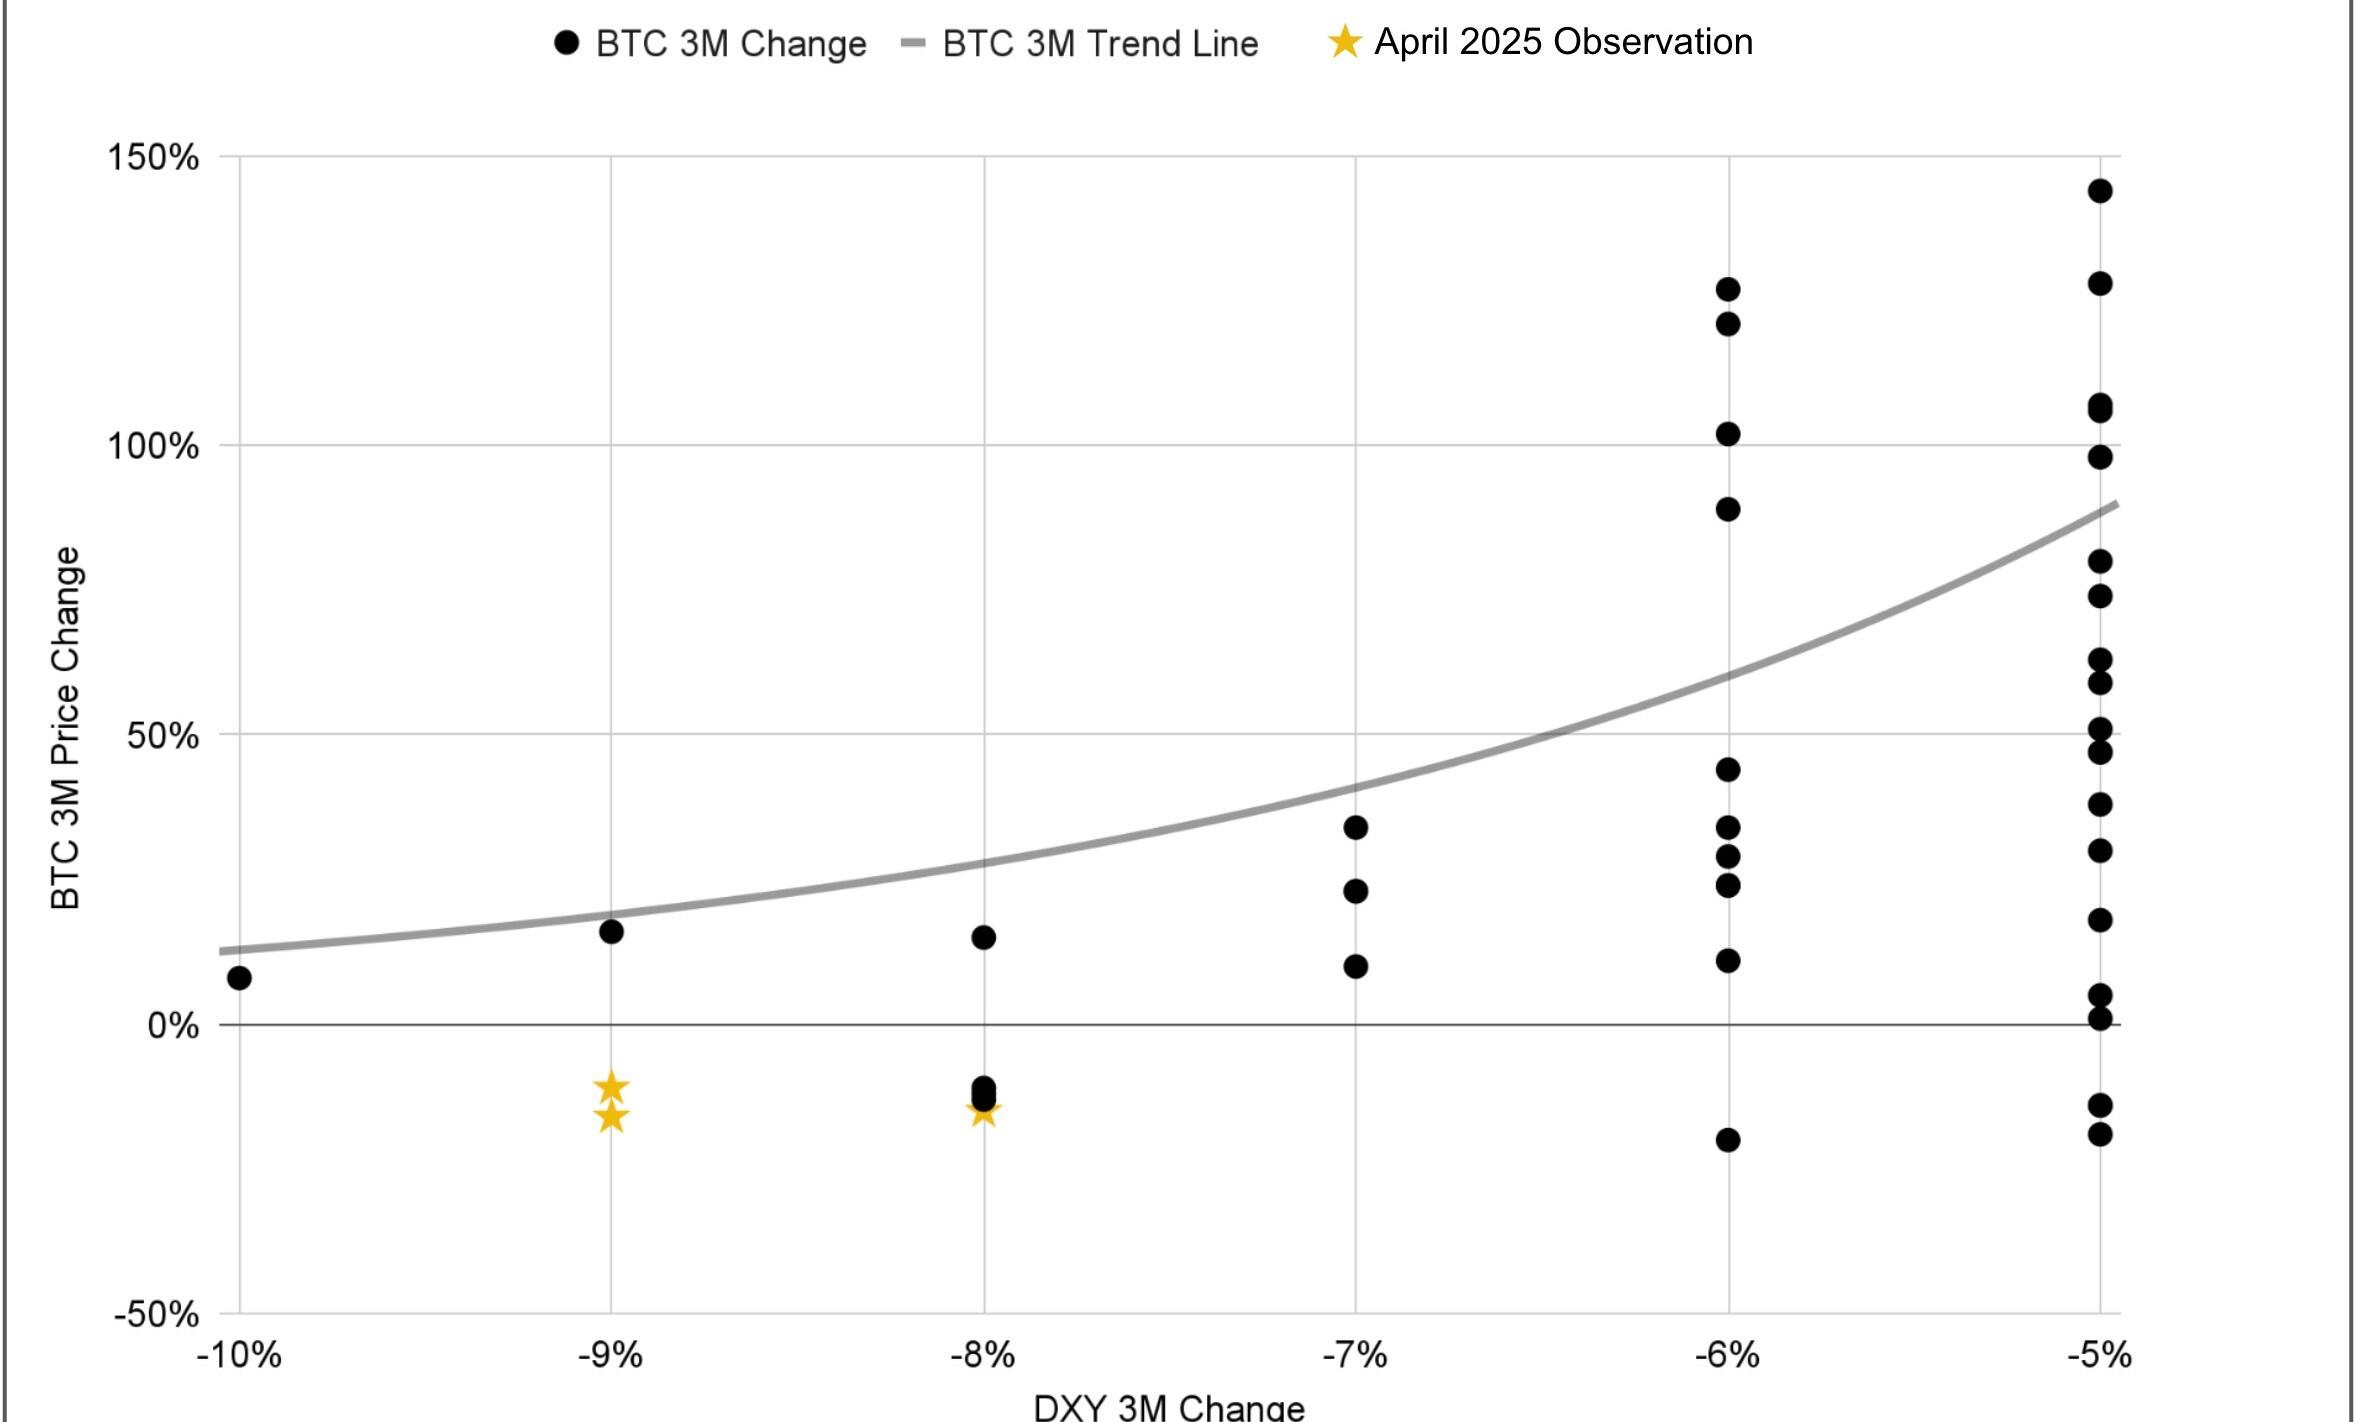
BTC price dynamics during rapid DXY decline. Source: Binance Research
However, BTC has traded relatively flat during periods of steeper DXY declines. "Historically, a ~9% drop in DXY has aligned with positive — but moderate — BTC performance compared to smaller dollar declines," the Binance Research team stated in an X post on Monday.
Since the DXY began dropping in January — down 9% in three months — Bitcoin has plunged by 6%, indicating signs of "deviation from the norm."
The changing price dynamics can be traced to investors showing increased risk-off sentiment since the global trade war commenced, but this time dumping the DXY, Bitcoin and stocks for Gold and the Euro Currency Index (EXY).
Interestingly, while the DXY, Bitcoin and US stocks rallied between October to January, the EXY suffered an 8% decline. However, the relationship has reversed since the tariffs set in, with the EXY rising over 11% in 2025 while the others plunged. Gold remained the outlier, rising more than 30% since December.
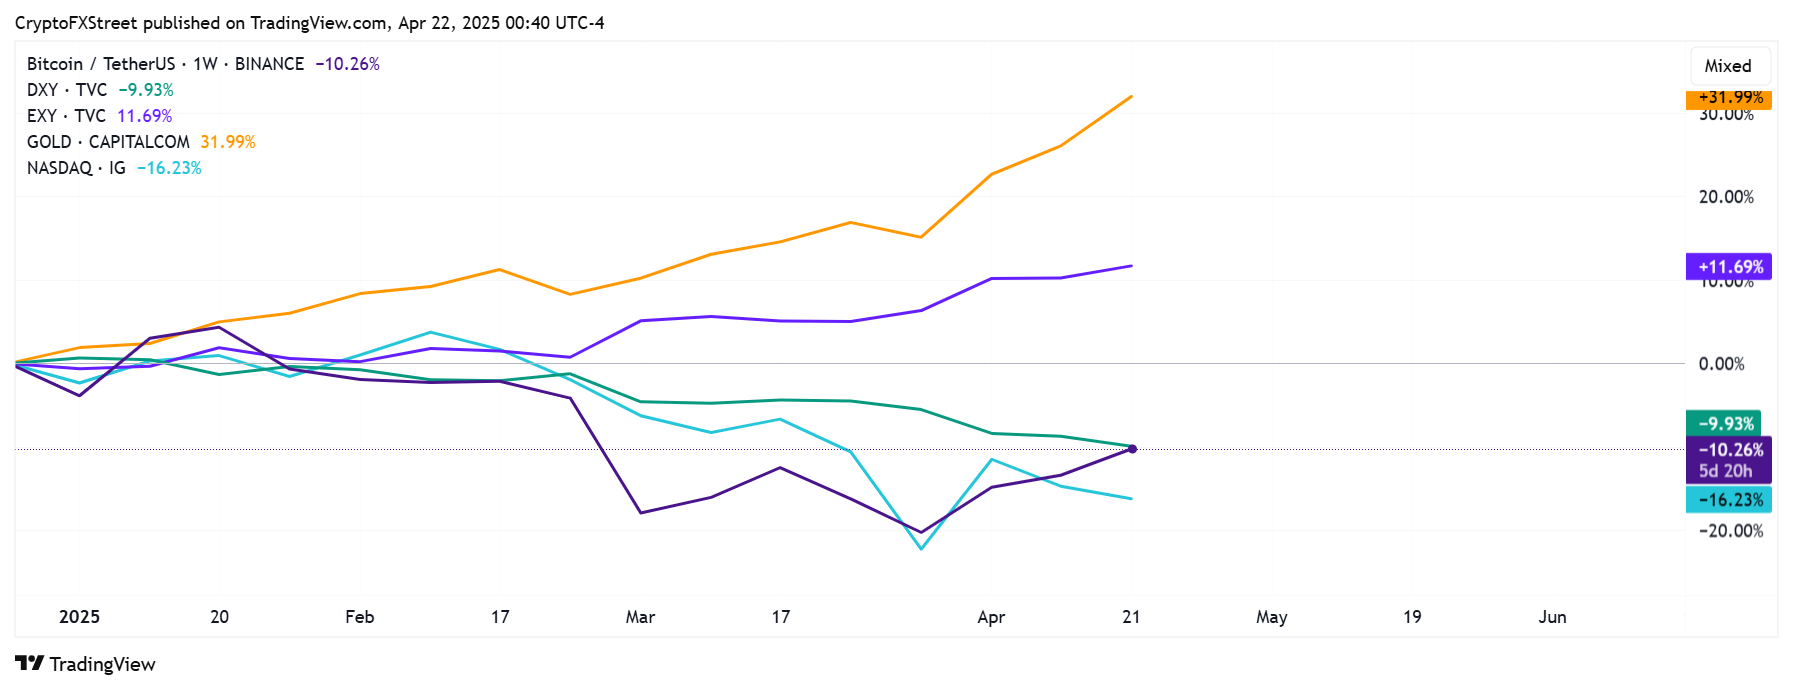
BTC vs DXY vs EXY vs XAU vs NASDAQ weekly chart
A CME Group Open Market report by Jim Iuorio, MD of TJM Institutional Services, revealed that Bitcoin and Gold witnessed a strong correlation between 2022 and the first half 2024, where Gold rallied as much as 67% and Bitcoin — which is more volatile — surged 400%. However, in 2025, Bitcoin has been decoupling from Gold, which has risen to a new ATH above $3,470. On the other hand, BTC declined from an ATH above $108,000 to as low as $76,000 before recovering slightly to $88,200 at press time.
The report suggested that BTC's deviation from Gold stems from two factors. Firstly, much of Bitcoin's recent performance has been based on buy-the-rumor and sell-the-news events — especially due to President Trump's campaign promises for the crypto industry. Secondly, the decoupling could be traced to most trading experts placing Bitcoin in the same bucket as traditional stock indexes due to its high volatility.
"Many institutional trading desks often group volatile assets like the Nasdaq and bitcoin into the same portfolio, assuming a Nasdaq traders' expertise in handling volatility equips them to manage bitcoin's price swings," the report stated. "Consequently, a sharp decline in the Nasdaq often triggers sales of bitcoin to cover margin requirements."
As a result, the rising correlation with stocks and decoupling from Gold has hampered Bitcoin's "digital gold" and "safe haven" narrative.
Iuorio noted that Gold's recent strength could also be responsible for Bitcoin's weakness. The ongoing trade war has seen investors show a preference for the former's rich historical store of value narrative — which dates back to ancient Egypt in 4000 BC — while rotating capital from the top cryptocurrency, which just came into existence in 2011.
However, the report also highlights that the increased digitalization of the world's financial system and Bitcoin's significant growth over the past 14 years signals it's "maturing at an accelerated pace."
Recommended Articles


