

Silver Price Forecast: XAG/USD refreshes weekly low near $33 as Fed is in no hurry for rate cuts
- Silver price tumbles to near $33 as the Fed sees no hurry for interest rate cuts.
- US President Trump’s policies are expected to push US inflation higher and economic growth lower.
- Potential Trump reciprocal tariffs limit the downside in Silver.
Silver price (XAG/USD) posts a fresh weekly low near $33.00 in Friday’s European session. The white metal extends its losing streak for the third trading day as the US Dollar (USD) extends its upside on deepening expectations that the Federal Reserve (Fed) will not cut interest rates in the near term.
The US Dollar Index (DXY), which tracks the Greenback’s value against six major currencies, jumps to near 104.00.
The Fed expressed that interest rates won’t be reduced until they seek clarity over how much United States (US) President Donald Trump’s tariffs will dampen economic growth and accelerate inflationary pressures. These signals came after the central bank left borrowing rates unchanged in the range of 4.25%-4.50% for the second time in a row.
The scenario of the Fed maintaining interest rates at their restrictive levels for longer bodes poorly for non-yielding assets, such as Silver.
Meanwhile, fears of Trump imposing reciprocal tariffs on April 2 would limit the downside in the Silver price. Trump’s tariff policies are expected to weigh on global growth. Historically, heightened global uncertainty improves the appeal of safe-haven assets.
Silver technical analysis
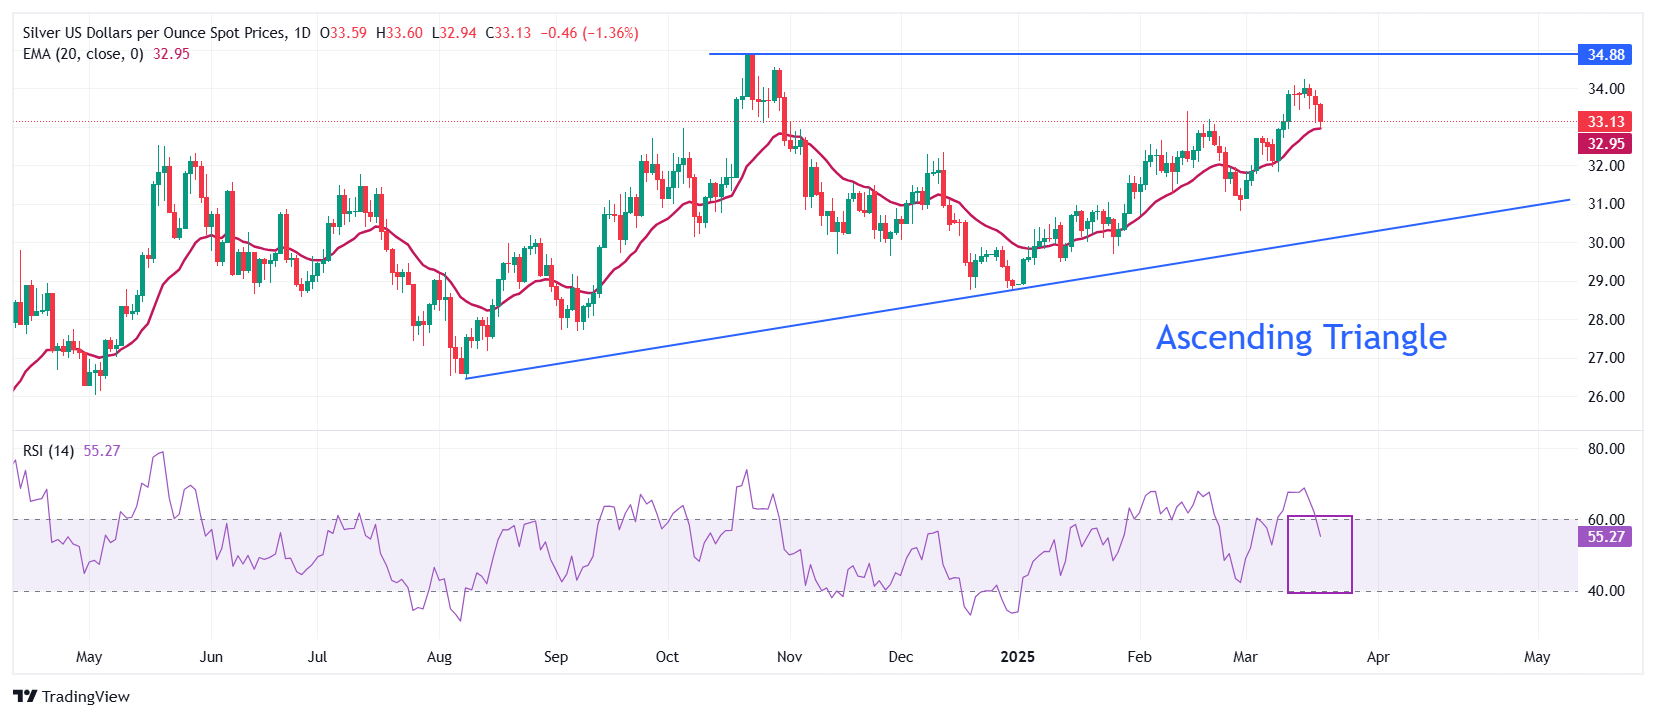
Silver price struggles to revisit the flat border of the Ascending Triangle chart pattern formation on the daily timeframe near the October 22 high of $34.87. The upward-sloping border of the above-mentioned chart pattern is placed from the August 8 low of $26.45. Technically, the Ascending Triangle pattern indicates indecisiveness among market participants.
The Silver price declines to near the 20-day Exponential Moving Average (EMA), which trades around $32.95.
The 14-day Relative Strength Index (RSI) falls below 60.00, suggesting that the bullish momentum has come to an end. However, the bullish bias is still intact.
Looking down, the March 6 high of $32.77 will act as key support for the Silver price. While, the October 22 high of $34.87 will be the major barrier.
Silver daily chart
Silver FAQs
Silver is a precious metal highly traded among investors. It has been historically used as a store of value and a medium of exchange. Although less popular than Gold, traders may turn to Silver to diversify their investment portfolio, for its intrinsic value or as a potential hedge during high-inflation periods. Investors can buy physical Silver, in coins or in bars, or trade it through vehicles such as Exchange Traded Funds, which track its price on international markets.
Silver prices can move due to a wide range of factors. Geopolitical instability or fears of a deep recession can make Silver price escalate due to its safe-haven status, although to a lesser extent than Gold's. As a yieldless asset, Silver tends to rise with lower interest rates. Its moves also depend on how the US Dollar (USD) behaves as the asset is priced in dollars (XAG/USD). A strong Dollar tends to keep the price of Silver at bay, whereas a weaker Dollar is likely to propel prices up. Other factors such as investment demand, mining supply – Silver is much more abundant than Gold – and recycling rates can also affect prices.
Silver is widely used in industry, particularly in sectors such as electronics or solar energy, as it has one of the highest electric conductivity of all metals – more than Copper and Gold. A surge in demand can increase prices, while a decline tends to lower them. Dynamics in the US, Chinese and Indian economies can also contribute to price swings: for the US and particularly China, their big industrial sectors use Silver in various processes; in India, consumers’ demand for the precious metal for jewellery also plays a key role in setting prices.
Silver prices tend to follow Gold's moves. When Gold prices rise, Silver typically follows suit, as their status as safe-haven assets is similar. The Gold/Silver ratio, which shows the number of ounces of Silver needed to equal the value of one ounce of Gold, may help to determine the relative valuation between both metals. Some investors may consider a high ratio as an indicator that Silver is undervalued, or Gold is overvalued. On the contrary, a low ratio might suggest that Gold is undervalued relative to Silver.
Recommended Articles


