

Silver Price Forecast: XAG/USD plummets as Trump’s election strengthens USD
- Silver breaks below key support levels, including 50-day SMA at $31.27.
- Daily close below $31.00 may lead to further decline toward 100-day SMA at $30.23.
- Resistance levels to watch: July 11 high at $31.75 and May 20 peak at $32.51.
Silver price slumped sharply on Wednesday after US President Donald Trump wins the 2024 presidential election. Additionally, the Republican party sweep seems likely as they hold the majority in the Senate, while the House of Representatives is still early to be called. The XAGU/USD trades at $31.16, down over 4.50%.
XAG/USD Price Forecast: Technical outlook
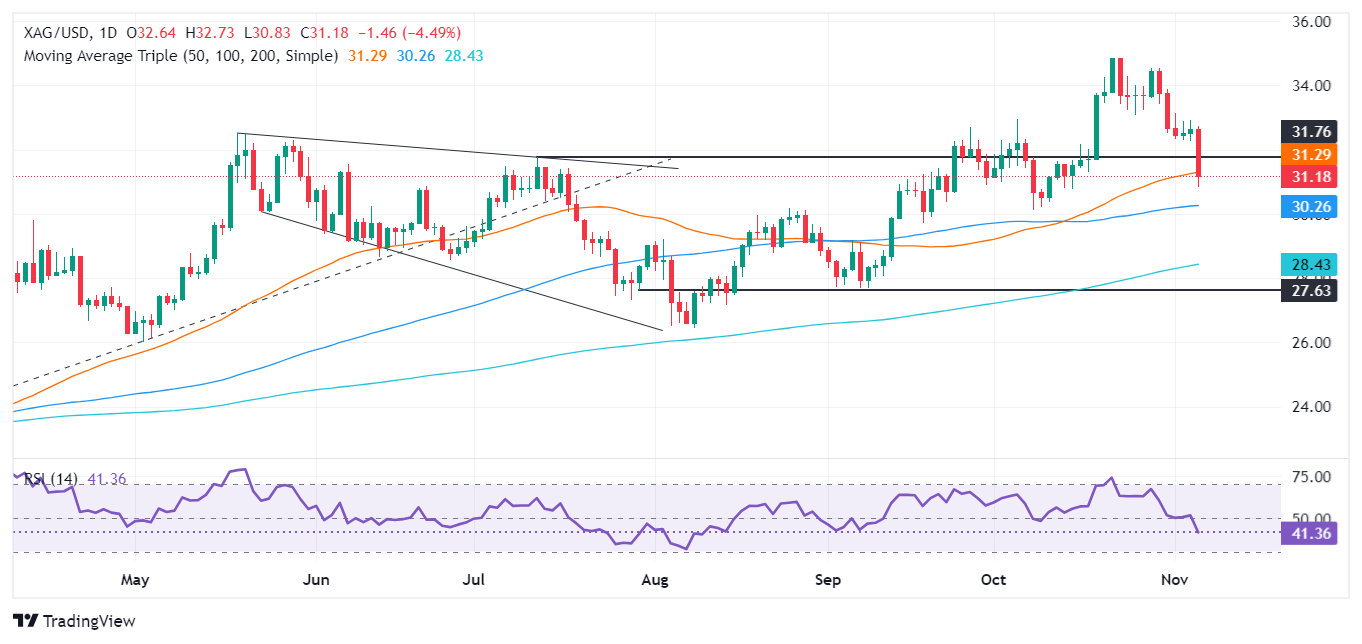
Silver's price uptrend remains in play, even though Trump’s victory boosted the Greenback. Consequently, the XAG/USD tumbled below key support levels, including the 50-day Simple Moving Average (SMA) at $31.27, which opened the door to hit a daily low of $30.84.
If XAG/USD achieves a daily close below $31.00, it could trigger a potential slump to the 100-day SMA at $30.23. If surpassed, the next stop would be the $30.00 figure.
On the upside, the next key resistance would be the July 11 high at $31.75. A breach of the latter will expose $32.00, followed by May’s 20 peak at $32.51.
XAG/USD Price Chart – Daily
Silver FAQs
Silver is a precious metal highly traded among investors. It has been historically used as a store of value and a medium of exchange. Although less popular than Gold, traders may turn to Silver to diversify their investment portfolio, for its intrinsic value or as a potential hedge during high-inflation periods. Investors can buy physical Silver, in coins or in bars, or trade it through vehicles such as Exchange Traded Funds, which track its price on international markets.
Silver prices can move due to a wide range of factors. Geopolitical instability or fears of a deep recession can make Silver price escalate due to its safe-haven status, although to a lesser extent than Gold's. As a yieldless asset, Silver tends to rise with lower interest rates. Its moves also depend on how the US Dollar (USD) behaves as the asset is priced in dollars (XAG/USD). A strong Dollar tends to keep the price of Silver at bay, whereas a weaker Dollar is likely to propel prices up. Other factors such as investment demand, mining supply – Silver is much more abundant than Gold – and recycling rates can also affect prices.
Silver is widely used in industry, particularly in sectors such as electronics or solar energy, as it has one of the highest electric conductivity of all metals – more than Copper and Gold. A surge in demand can increase prices, while a decline tends to lower them. Dynamics in the US, Chinese and Indian economies can also contribute to price swings: for the US and particularly China, their big industrial sectors use Silver in various processes; in India, consumers’ demand for the precious metal for jewellery also plays a key role in setting prices.
Silver prices tend to follow Gold's moves. When Gold prices rise, Silver typically follows suit, as their status as safe-haven assets is similar. The Gold/Silver ratio, which shows the number of ounces of Silver needed to equal the value of one ounce of Gold, may help to determine the relative valuation between both metals. Some investors may consider a high ratio as an indicator that Silver is undervalued, or Gold is overvalued. On the contrary, a low ratio might suggest that Gold is undervalued relative to Silver.
Recommended Articles


