


Crude Oil turns flat this week after Thursday’s recovery
- After a volatile week, Crude Oil trades flat and stabilizes near $75 on Friday.
- Israel has signalled it is ready to retaliate against Iran’s attacks, increasing tensions and supporting Crude Oil prices.
- The US Dollar Index halts its rally after peaking at the highest level in nearly two months.
Crude Oil is back to square one for this week, stabilizing around Monday’s opening price near $75.00. The recovery from the lower levels seen earlier this week comes after Israel signaled it is ready to retaliate against Iran. The headline comes after United States (US) President Joe Biden had a phone call with Israel Prime Minister Benjamin Netanyahu on Wednesday, with President Biden urging not to attack Iranian oil installations. Meanwhile, Florida is measuring the damage of Hurricane Milton, and Oil platforms in the US Gulf of Mexico are preparing to reopen again.
The US Dollar Index (DXY), which tracks the performance of the Greenback against six other currencies, slightly retraces on Friday after its small pop on Thursday, when the US Consumer Price Index (CPI) release for September made the DXY peak to 103.18. Unfortunately, it hit resistance and saw some profit-taking going into Friday’s.
At the time of writing, Crude Oil (WTI) trades at $74.73 and Brent Crude at $78.55
Oil news and market movers: Intense weekend
- The Washington Post reports that Israel's war cabinet is meeting this Friday to decide how it will retaliate. The cabinet meeting follows Wednesday's 30-minute phone call between US President Biden and Israeli Prime Minister Netanyahu to consider the response.
- US Shale price is being calculated at around $66 per barrel, Bloomberg calculated. This means at current prices, the US will keep upscaling its shale production in order to supply enough Oil to markets and keep oil prices under control.
- At 17:00 GMT, the Baker Hughes Oil Rig Count is due. The previous reading was at 479 rigs, with no forecast available.
Oil Technical Analysis: Eventful weekend ahead
Crude Oil is set to head into a very eventful weekend, with Israel signalling it is ready to retaliate against Iran. Thus, traders can expect a lot of headlines over the weekend on geopolitics in the Middle East. And as if that is not enough, the Chinese government is set to announce possibly more stimulus measures, which will only see its impact by Monday when markets open.
Monday’s false break is to be ignored, as the move was fully paired back on Tuesday. It means that current pivotal levels on the upside are still valid: the red descending trendline in the chart below, and the 100-day Simple Moving Average (SMA) at $75.61 just hovering above it, makes that region very difficult to surpass. Once holding above that zone, the 200-day SMA at $77.17 should refute any further upticks as it did in early trading on Tuesday.
On the downside, there is a similar remark as for the upside with this false break. The rule of thumb is that if there has not been a daily close below the level, it still acts as a support. First is the 55-day SMA at $72.52, which acts as a potential first line of defence. A bit further down, $71.46 (the February 5 low) comes into play as second support before looking back to the $70.00 big figure and $67.11 as ultimate support for traders to buy the dip.
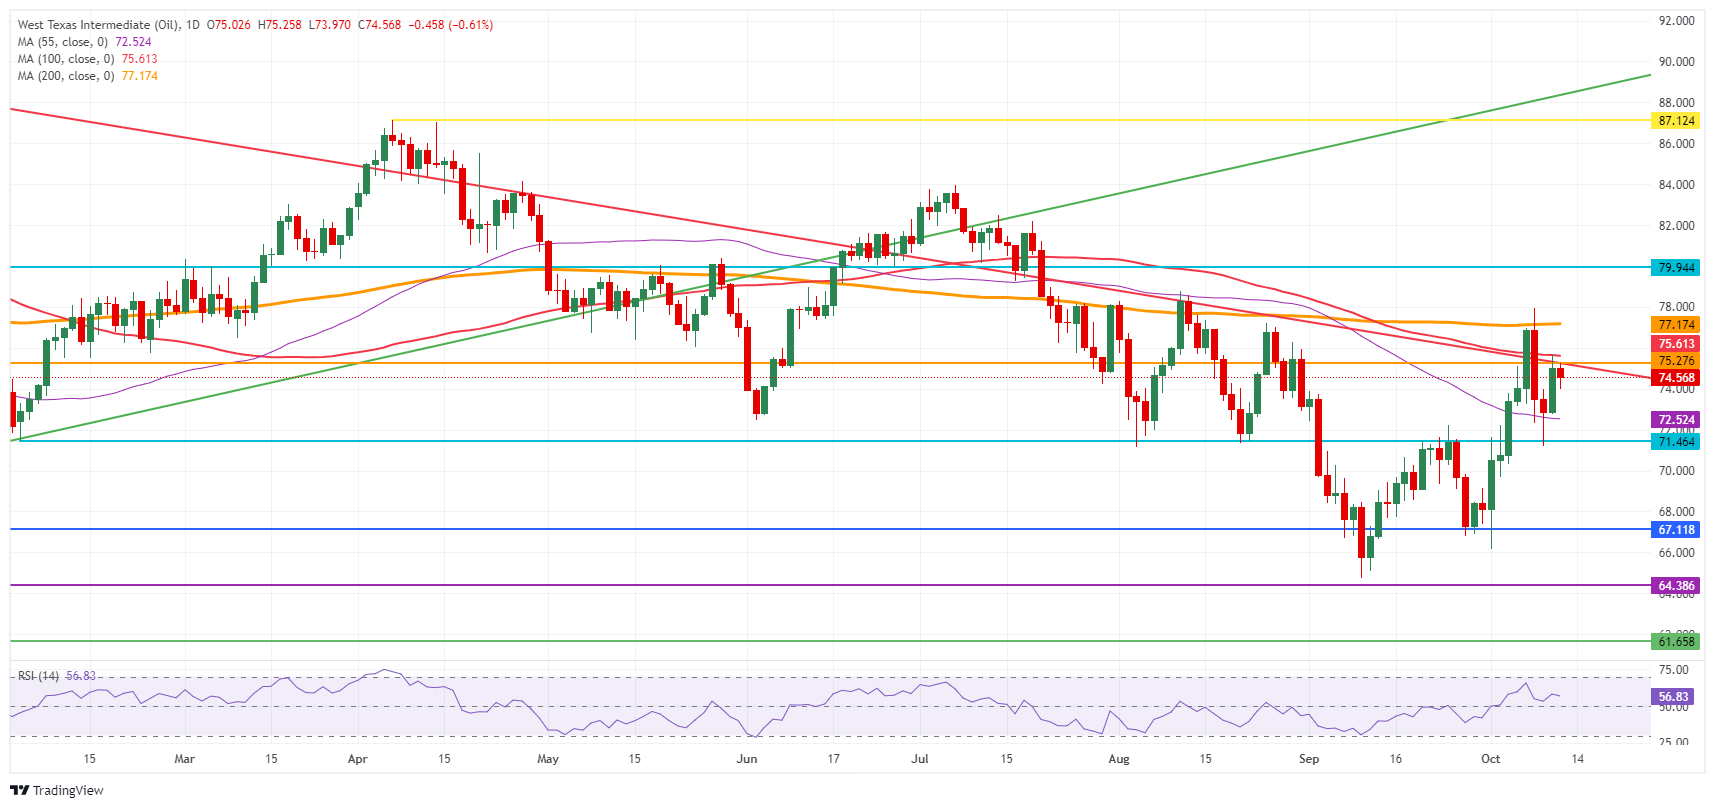
US WTI Crude Oil: Daily Chart
WTI Oil FAQs
WTI Oil is a type of Crude Oil sold on international markets. The WTI stands for West Texas Intermediate, one of three major types including Brent and Dubai Crude. WTI is also referred to as “light” and “sweet” because of its relatively low gravity and sulfur content respectively. It is considered a high quality Oil that is easily refined. It is sourced in the United States and distributed via the Cushing hub, which is considered “The Pipeline Crossroads of the World”. It is a benchmark for the Oil market and WTI price is frequently quoted in the media.
Like all assets, supply and demand are the key drivers of WTI Oil price. As such, global growth can be a driver of increased demand and vice versa for weak global growth. Political instability, wars, and sanctions can disrupt supply and impact prices. The decisions of OPEC, a group of major Oil-producing countries, is another key driver of price. The value of the US Dollar influences the price of WTI Crude Oil, since Oil is predominantly traded in US Dollars, thus a weaker US Dollar can make Oil more affordable and vice versa.
The weekly Oil inventory reports published by the American Petroleum Institute (API) and the Energy Information Agency (EIA) impact the price of WTI Oil. Changes in inventories reflect fluctuating supply and demand. If the data shows a drop in inventories it can indicate increased demand, pushing up Oil price. Higher inventories can reflect increased supply, pushing down prices. API’s report is published every Tuesday and EIA’s the day after. Their results are usually similar, falling within 1% of each other 75% of the time. The EIA data is considered more reliable, since it is a government agency.
OPEC (Organization of the Petroleum Exporting Countries) is a group of 12 Oil-producing nations who collectively decide production quotas for member countries at twice-yearly meetings. Their decisions often impact WTI Oil prices. When OPEC decides to lower quotas, it can tighten supply, pushing up Oil prices. When OPEC increases production, it has the opposite effect. OPEC+ refers to an expanded group that includes ten extra non-OPEC members, the most notable of which is Russia.
Recommended Articles


