


Gold price rises ahead of US CPI data and first Harris/Trump presidential debate
- Gold price increases as US Treasury yields drop and the US Dollar weakens.
- Traders await US CPI data; Fed rate cut odds are 67% for a 25 bps reduction and 33% for 50 bps.
- Focus shifts to the first US presidential debate, potentially impacting market sentiment ahead of election.
Gold prices advanced in the mid-North American session on Tuesday, gaining some 0.30% as traders braced for the crucial August inflation report from the United States (US). This, along with the first presidential debate between Vice President Kamala Harris and former President Donald Trump, could influence the financial markets. The XAU/USD trades at $2,514, bouncing off daily lows of $2,500.
The market mood has slightly improved, while the Greenback pared some of its earlier gains, a tailwind for the golden metal. US Treasury bond yields fell ahead of the latest Consumer Price Index (CPI) reading. Figures are expected to justify the Federal Reserve's (Fed) dovish stance toward beginning a rate cutting cycle amid fears that the labor market could weaken.
The latest US jobs report revealed that the economy added fewer people to the workforce than expected, but the Unemployment Rate ticked lower, a relief for Fed policymakers.
Meanwhile, the swaps market shows the odds for a 50 bps cut have increased to 33%, while they stand at 67% for 25 bps, according to the CME FedWatch Tool. Earlier, a Reuters poll revealed that 92 of 101 economists expect the Federal Reserve (Fed) to lower interest rates by 25 basis points (bps) at the September 17-18 meeting.
Political developments should begin to gain attention before the US Presidential Election on November 5. Vice President Kamala Harris and Donald Trump will meet for their first debate on Tuesday at 21:00 ET (01:00 GMT) via ABC.
Daily digest market moves: Gold price climbs as traders eye US CPI
- Gold price advances on Tuesday as the Greenback erases its earlier gains. The US Dollar Index (DXY), which tracks the buck's performance against six currencies, is virtually unchanged at 101.62.
- US 10-year T-note yield drops five basis points to 3.648%, reflecting traders' positioning ahead of September 18-19.
- US August CPI is expected to decline from 2.9% to 2.6% YoY, while core CPI is projected to remain at 3.2%.
- Last week’s NFP report revealed the economy added over 142K employees to the workforce but missed consensus of 160K. However, the dip in the Unemployment Rate lent a lifeline to the Greenback.
- Last Friday, Fed officials were dovish. New York Fed President John Williams said that cutting rates will help keep the labor market balanced, while Governor Christopher Waller said that “the time has come” to ease policy.
- Chicago Fed President Austan Goolsbee was dovish, saying policymakers have an “overwhelming” consensus to reduce borrowing costs.
- It is worth noting that Fed officials entered their blackout period ahead of the Federal Open Market Committee (FOMC) monetary policy meeting.
- Data from the Chicago Board of Trade (CBOT) indicates that the Fed is anticipated to cut at least 108 basis points (bps) this year, based on the fed funds rate futures contract for December 2024.
Technical outlook: Gold price holds gains above $2,500
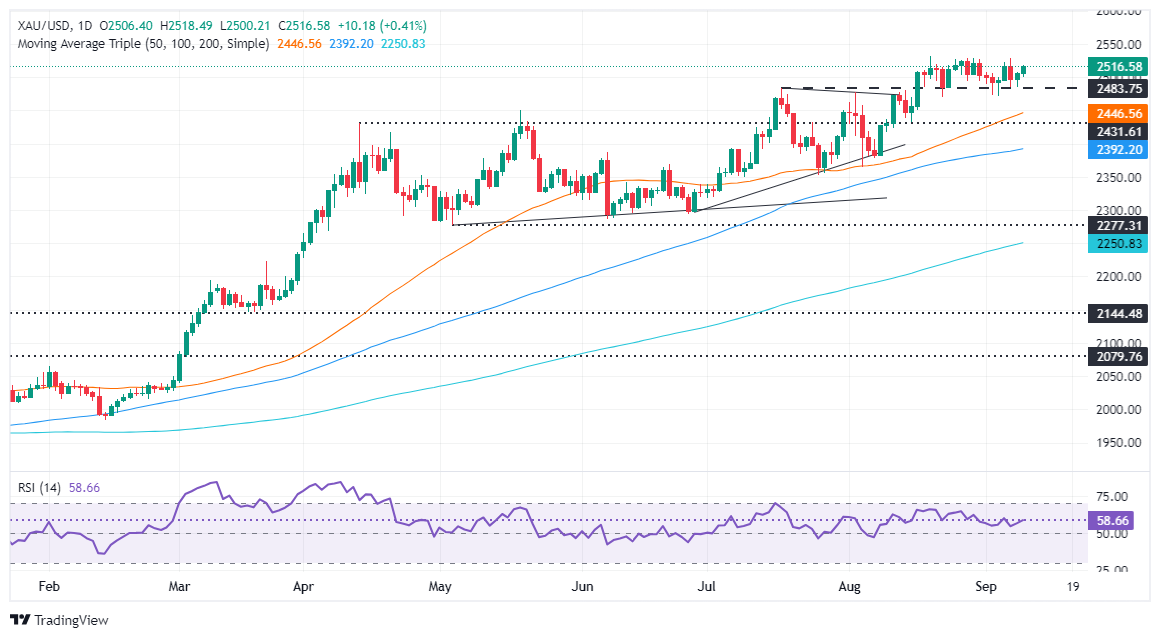
From a technical standpoint, XAU/USD climbs steadily yet cannot break above the all-time high of $2,531 as traders brace for a critical data release on Wednesday. Momentum shows Gold should remain trading sideways, based on the Relative Strength Index (RSI), which is almost flat.
If Gold clears the ATH, the next resistance would be the $2,550 mark. Once hurdled, the next stop would be the psychological $2,600 figure.
Conversely, if Gold price slides below $2,500, the next support would be the August 22 low at $2,470. On further weakness, the next demand zone would be the confluence of the May 20 high, which turned into support, and the 50-day Simple Moving Average (SMA) between $2,450 and $2,440.
Gold FAQs
Gold has played a key role in human’s history as it has been widely used as a store of value and medium of exchange. Currently, apart from its shine and usage for jewelry, the precious metal is widely seen as a safe-haven asset, meaning that it is considered a good investment during turbulent times. Gold is also widely seen as a hedge against inflation and against depreciating currencies as it doesn’t rely on any specific issuer or government.
Central banks are the biggest Gold holders. In their aim to support their currencies in turbulent times, central banks tend to diversify their reserves and buy Gold to improve the perceived strength of the economy and the currency. High Gold reserves can be a source of trust for a country’s solvency. Central banks added 1,136 tonnes of Gold worth around $70 billion to their reserves in 2022, according to data from the World Gold Council. This is the highest yearly purchase since records began. Central banks from emerging economies such as China, India and Turkey are quickly increasing their Gold reserves.
Gold has an inverse correlation with the US Dollar and US Treasuries, which are both major reserve and safe-haven assets. When the Dollar depreciates, Gold tends to rise, enabling investors and central banks to diversify their assets in turbulent times. Gold is also inversely correlated with risk assets. A rally in the stock market tends to weaken Gold price, while sell-offs in riskier markets tend to favor the precious metal.
The price can move due to a wide range of factors. Geopolitical instability or fears of a deep recession can quickly make Gold price escalate due to its safe-haven status. As a yield-less asset, Gold tends to rise with lower interest rates, while higher cost of money usually weighs down on the yellow metal. Still, most moves depend on how the US Dollar (USD) behaves as the asset is priced in dollars (XAU/USD). A strong Dollar tends to keep the price of Gold controlled, whereas a weaker Dollar is likely to push Gold prices up.
Recommended Articles


