XAG/USD Price Analysis: Bears advance as markets adjusts dovish bets on the Fed

Source Fxstreet
  • The XAG/USD declined to its lowest level since mid-November near $22.20.
  • Markets are repricing their bets on the Fed, and the odds of cuts in March decline.
  • Despite recovery signals from four-hour chart indicators, the prevailing bearish trend keeps the bulls at bay with the pair positioned under key SMAs.

In Monday's session, the XAG/USD pair is trading at $22.14, showcasing 2% decline, following to multi-month lows. The daily chart paints a largely bearish picture, with selling pressure beginning to assert dominance. The 4-hour technical outlook indicates a recovery from oversold conditions, offering a glimmer of respite in an otherwise downwardly skewed market.

In the meantime, markets are making some adjustments in easing expectations and now, the swaps market is pricing in 125 bp of easing over the course of 2024 vs. nearly 175 bp seen earlier this month while the odds of a cut in March dropped below 50%. However, this seems highly unlikely considering the strength of the US economy. Important upcoming events include key central bank meetings this week and an official Q4 GDP data to be reported on Thursday alongside, Personal Consumption Expenditures (PCE), the Fed’s preferred gauge of inflation, from the last month of 2023. The outcome of this data may shape the expectations from the markets and set the precious metal’s pace for the next sessions.

XAG/USD levels to watch

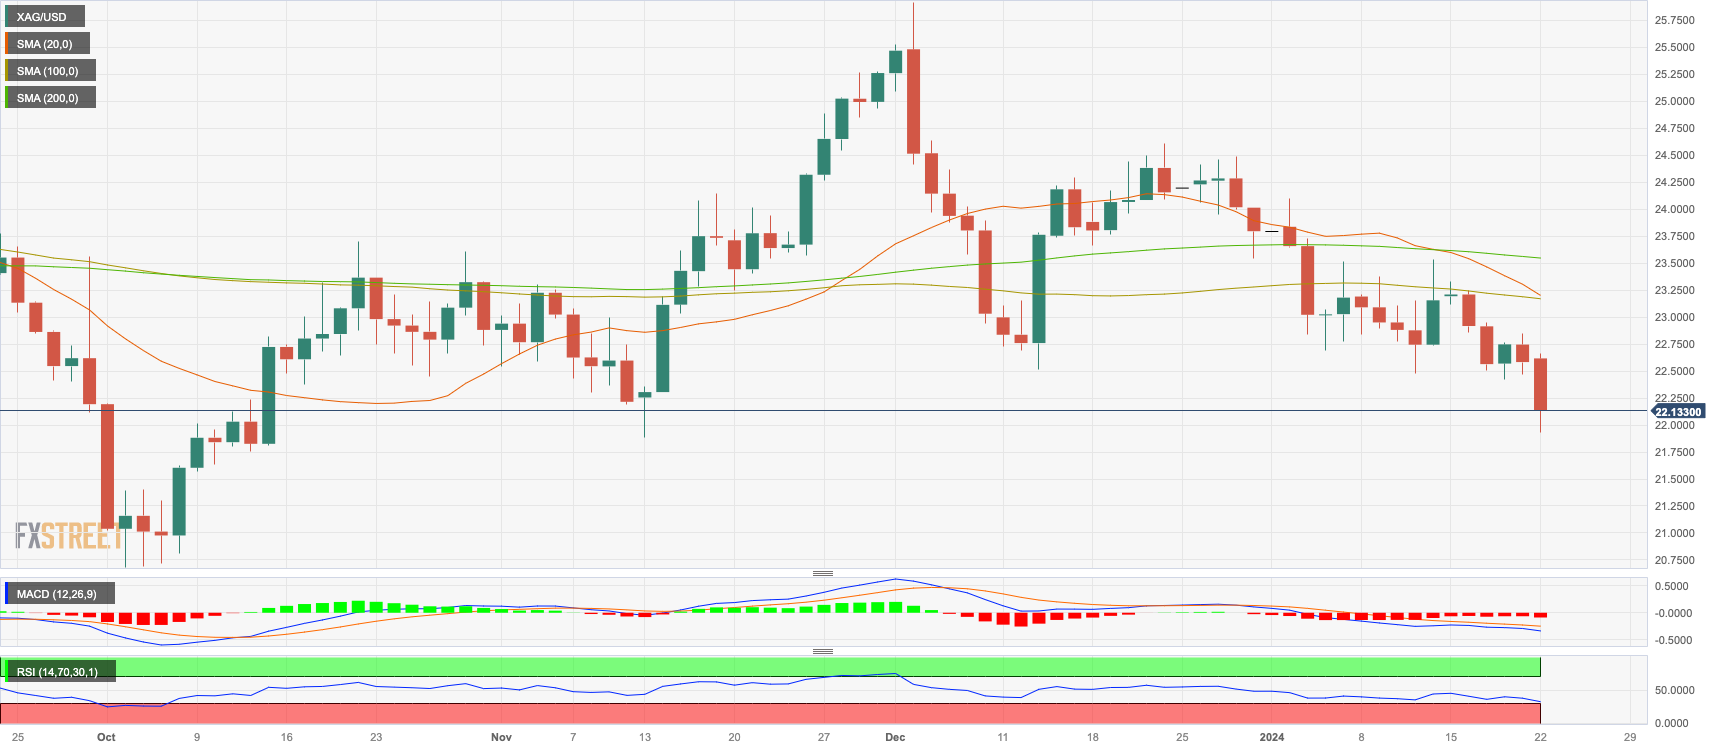
Analyzing daily chart movements, the technical situation reveals dominance of selling momentum. The Relative Strength Index (RSI) is descending and in a downtrend, signaling an intensification of bearish momentum. Consistent with this, the Moving Average Convergence Divergence (MACD) red bars are on the rise, which also suggests strengthening of bearish momentum. In addition, the pair is trading beneath their 20, 100, and 200-day Simple Moving Averages (SMAs), which confirms that the bears are in control on a broader spectrum, further reinforcing the notion of enhanced bearish momentum.

Moving to the shorter time frame, the four-hour chart suggest thatindicators are correcting oversold conditions, showing some respite for the buyers. Yet, the bearish momentum is too dominant to dismiss. The Relative Strength Index (RSI) continues to descend in the negative territory, lending weight to the bearish bias. In conjection, the Moving Average Convergence Divergence (MACD) reflects rising red bars, yet again indicating increased seller influence.

XAG/USD daily chart


Disclaimer: For information purposes only. Past performance is not indicative of future results.
placeholder
Yen Exchange Rate’s Shock Jump. Dropping 200 Pips Near 160 Level, BOJ’s Inaction Hides a Mystery, Buy the Dip or Seek Safety?The 'rollercoaster' Yen has once again become the focus of the foreign exchange market! On January 23, USD/JPY experienced a series of 'rollercoaster' short-term movements, plunging nearl
Author  TradingKey
Yesterday 10: 20
The 'rollercoaster' Yen has once again become the focus of the foreign exchange market! On January 23, USD/JPY experienced a series of 'rollercoaster' short-term movements, plunging nearl
placeholder
AUD/JPY retreats from 109.00 as "rate check" by Japan's Finance Ministry lifts JPYThe AUD/JPY cross retreats nearly 130 pips from the highest level since July 2024, around the 109.00 mark touched earlier this Friday, though the pullback lacks follow-through.
Author  FXStreet
Yesterday 10: 02
The AUD/JPY cross retreats nearly 130 pips from the highest level since July 2024, around the 109.00 mark touched earlier this Friday, though the pullback lacks follow-through.
placeholder
Where crypto market structure bill stands nowThe digital assets market stands still while US lawmakers are moving closer to a committee vote on a crypto structure bill. However, reports suggest that there are deep political divisions that still remain, and bipartisan support looks uncertain. The industry leaders have also shared their separate views on the bill. On one hand, Brian Armstrong, […]
Author  Cryptopolitan
Yesterday 09: 05
The digital assets market stands still while US lawmakers are moving closer to a committee vote on a crypto structure bill. However, reports suggest that there are deep political divisions that still remain, and bipartisan support looks uncertain. The industry leaders have also shared their separate views on the bill. On one hand, Brian Armstrong, […]
placeholder
Top 3 Price Forecast: BTC Shows Early Stabilization; ETH and XRP Still Look HeavyBTC trades near $89,900 after holding $87,787 support and eyeing the $91,942 50-day EMA, while ETH (~$2,964) remains capped below $3,017 and XRP (~$1.91) keeps downside risk toward $1.77 after failing to reclaim key levels.
Author  Mitrade
Yesterday 05: 56
BTC trades near $89,900 after holding $87,787 support and eyeing the $91,942 50-day EMA, while ETH (~$2,964) remains capped below $3,017 and XRP (~$1.91) keeps downside risk toward $1.77 after failing to reclaim key levels.
placeholder
Research Warns Bitcoin ‘Diamond Hand’ Selling Is Not a Repeat of 2017 or 2021Bitcoin's two-year-plus long-term holders set a new record in sales during 2024 and 2025, differentiating this bull market from previous ones and signaling a potential shift in investor strategy.
Author  Mitrade
Yesterday 02: 07
Bitcoin's two-year-plus long-term holders set a new record in sales during 2024 and 2025, differentiating this bull market from previous ones and signaling a potential shift in investor strategy.
Related Instrument
goTop
quote