


WTI Crude Oil Price Forecast: Could Oil Return Above $100 as US-Iran Conflict Escalates Further?
TradingKey - As of the Asian session on September 8, WTI crude oil prices (USOIL) continued to fluctuate at high levels, with the latest price trading higher near $92.30, up 1.2% on the day after touching a nearly two-month high of $93.29. Over the past week, WTI has accumulated a gain of nearly 10%. The re-escalation of the US-Iran conflict, shipping restrictions in the Strait of Hormuz, and OPEC+'s pause on further production increases have jointly provided sustained upward momentum for oil prices.
Escalating US-Iran Conflict Reignites Supply Concerns
From a fundamental perspective, WTI has continued to climb recently, with the core driver remaining Middle East crude supply risks stemming from the escalating U.S.-Iran conflict. As both sides launch a new round of actions targeting oil tankers and related military targets, market focus has shifted from pure geopolitical tension to whether the conflict will further affect shipping through the Strait of Hormuz and crude oil exports from the Persian Gulf.
Recently, the number of commodity vessels passing through the Strait of Hormuz has dropped noticeably, while safety and insurance risks facing commercial oil tankers have risen in tandem. Given that the Strait of Hormuz handles a substantial portion of global oil transport, if traffic remains persistently below normal levels, even if crude exports are not completely disrupted, the market will need to price in a higher risk premium for potential supply losses.
Meanwhile, OPEC+ decided to maintain its existing production policy unchanged in October, pausing its previous streak of consecutive output increases. This means that amid rising supply uncertainty in the Middle East, the short-term buffer of additional supply from OPEC+ is reduced, providing further support to oil prices.
However, WTI has already risen rapidly from near $80 in late August to above $92, with some geopolitical risk already priced in. Whether oil prices can further challenge $97 or even $100 going forward will depend critically on the actual shipping conditions in the Strait of Hormuz and whether Middle East crude experiences more pronounced supply losses.
If attacks on commercial tankers expand further, or if energy facilities such as major oil fields and export terminals are affected, WTI could still continue to move higher; conversely, if signals of negotiations or a ceasefire emerge between the U.S. and Iran and shipping recovers, the current elevated risk premium could rapidly recede.
WTI Crude Oil Price Technical Analysis: $93.50 Becomes Key Resistance
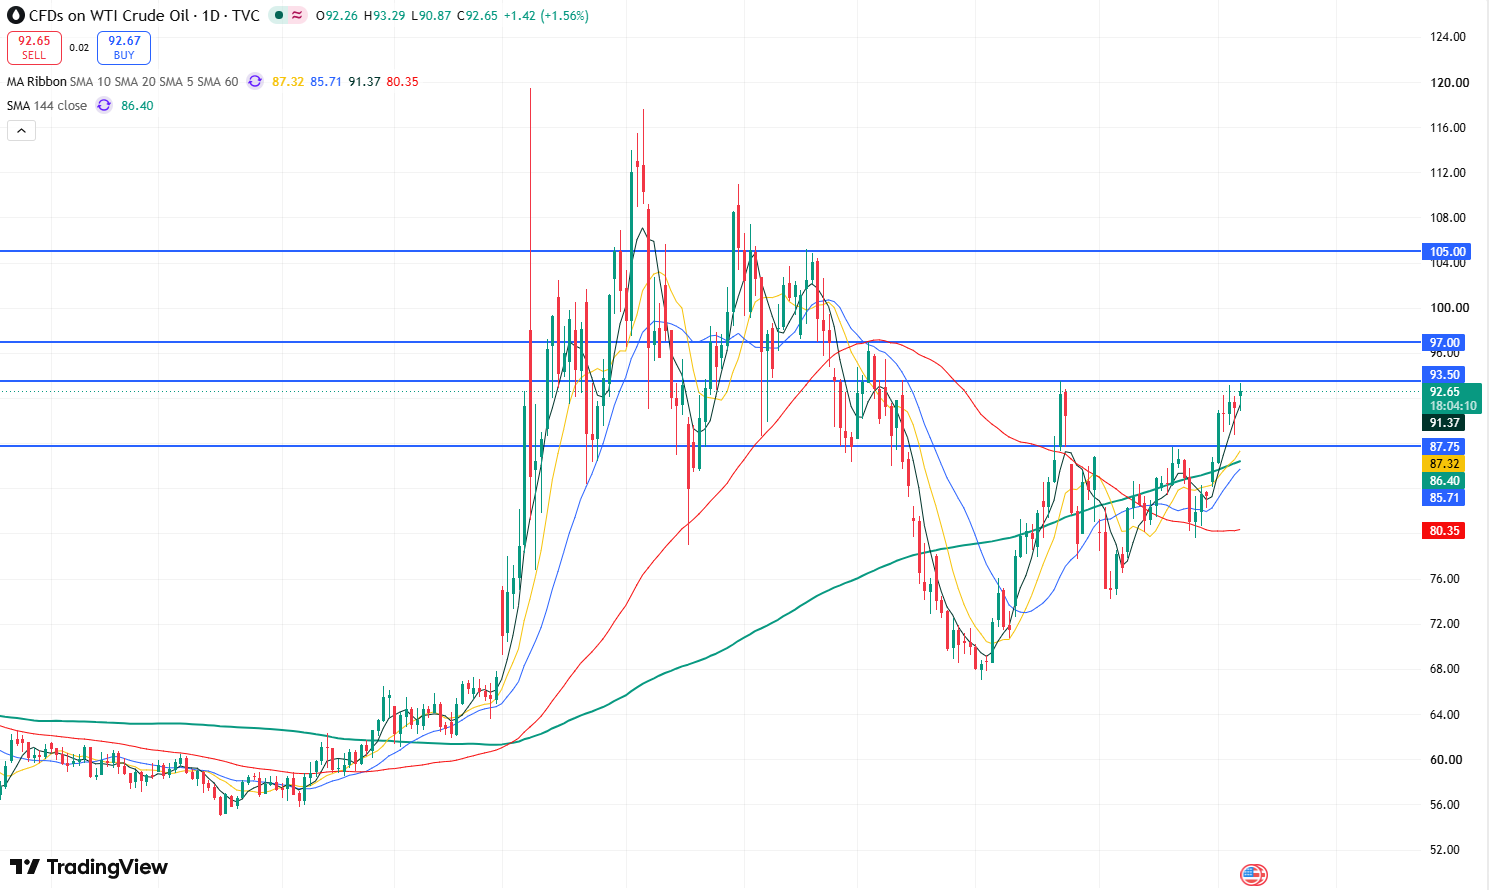
WTI crude oil price daily chart, source: TradingView
Looking at the daily chart of WTI crude oil prices, driven by the escalation of the US-Iran conflict, oil prices recently rose from $80 to a high of $93.29. The short-term candlestick structure shows a distinct pattern of continuously higher highs and higher lows, indicating that the short-term uptrend remains intact. Meanwhile, the 5-day and 10-day moving averages sequentially crossed above the 144-day moving average, forming a golden cross structure and further strengthening short-term bullish momentum.
Currently, oil prices today advanced to just below the July 23 rebound high of $93.50, increasing short-term upside pressure. If oil prices can effectively break through and hold above $93.50, it will open up upside space toward $97.00. Further up, prices could test the $100 mark and even challenge $105.
On the downside, the primary support level to watch below is the $91-$90 range. If oil prices fall below $90, they may further test support near $87.70 down below; if the decline continues, they could test support at the 20-day moving average.
Recommended Articles


