


WTI Oil climbs as Middle East supply risks remain evelated
- WTI Oil extends its advance as attacks on vessels raise fresh supply concerns.
- A strike on Saudi Aramco’s Jazan refinery adds to worries over regional Oil infrastructure.
- The technical setup stays bullish, although the RSI approaches overbought territory.
West Texas Intermediate (WTI) Oil edges higher on Monday as fresh attacks by the United States and Iran over the weekend add to already elevated supply concerns from the months-long war in the Middle East. At the time of writing, WTI trades around $91.15 per barrel, its highest level since July 24.
US Central Command said it struck three Iranian vessels, including one near Kharg Island, another near Jask and an empty tanker in the Gulf of Oman, in response to earlier Iranian missile attacks on US Navy warships.
Iranian state media reported on Sunday that its forces struck an unmanned US vessel, although US Central Command denied the claim. Iran also said it targeted three commercial Oil tankers travelling along routes Tehran considers unauthorised.
Al Jazeera reported that Iran’s top security official, Mohsen Rezaei, said Tehran will declare a restricted zone near the Strait of Hormuz and announce a new shipping route agreed with Oman in the coming days.
Adding to supply concerns, the Financial Times reported that Saudi Aramco’s Jazan Oil refinery was hit by a fresh strike on Monday. The extent of the damage is still being assessed, while Aramco has not publicly commented. The facility can process around 400,000 barrels of crude per day.
Meanwhile, OPEC+ kept its Oil output policy unchanged for October at Sunday’s meeting. With no fresh supply increase announced, Oil prices are likely to stay sensitive to disruptions in the Middle East as the United States and Iran trade threats of further retaliation.
Technical Analysis
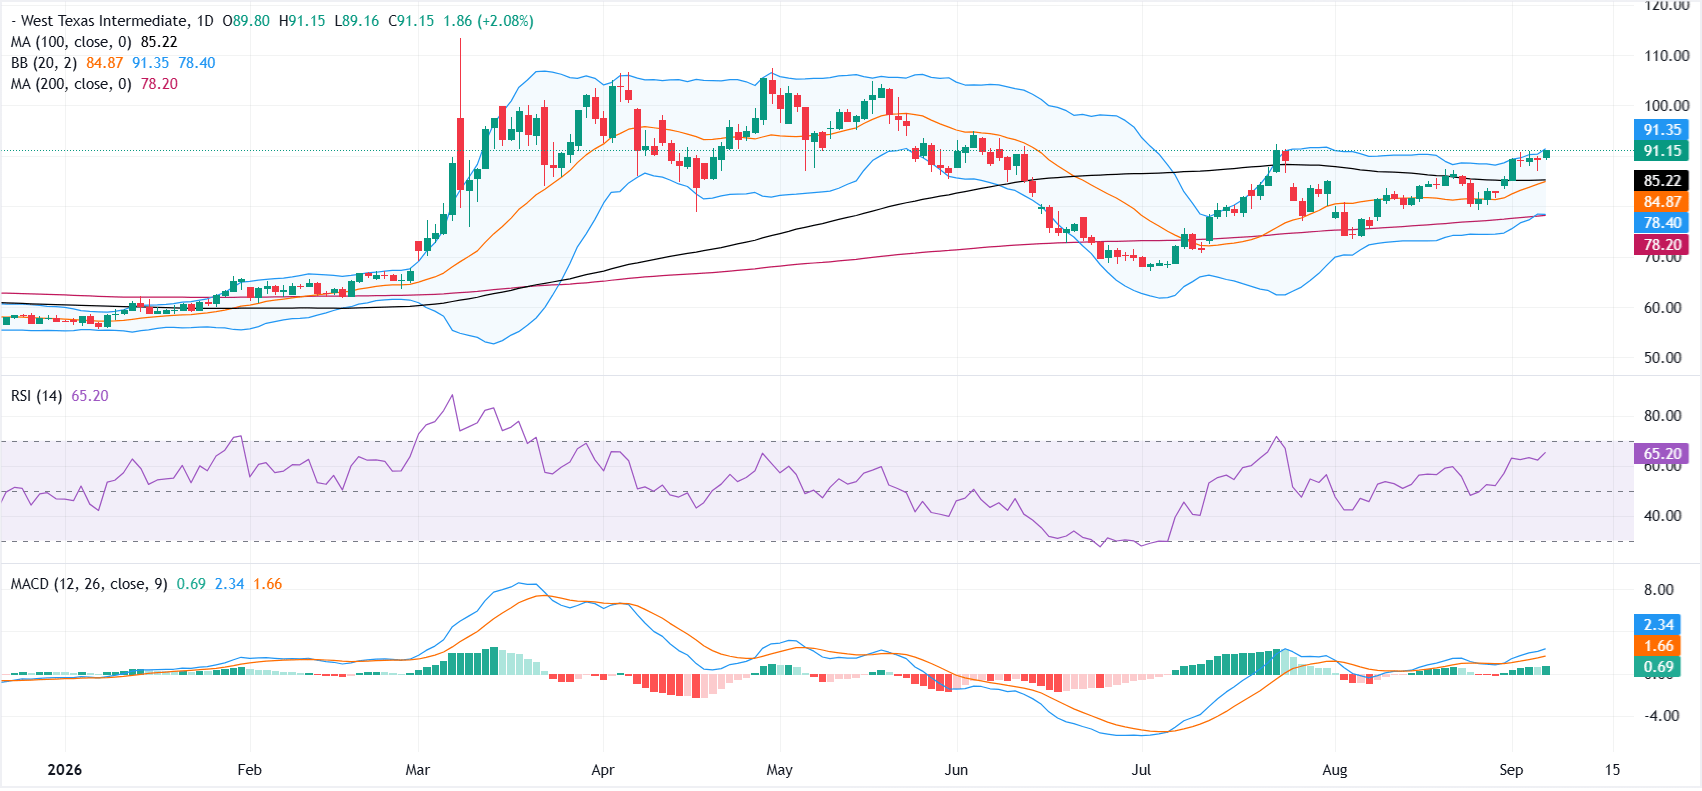
On the daily chart, WTI US Oil retains a bullish bias as it holds well above the 100-day Simple Moving Average (SMA) and the 200-day SMA.
Price also trades above the Bollinger Bands’ 20-day SMA around $84, while momentum remains constructive, with the Relative Strength Index (RSI) hovering near 65 and Moving Average Convergence Divergence (MACD) positive above zero, hinting that upside pressure remains in place but is edging toward overextended territory.
On the topside, initial resistance is defined by the Bollinger upper band around $91. A daily close above this level would open the door to further gains and extend the current bullish phase. On the downside, immediate support is seen near the current area, with a pullback toward the 100-day SMA at $85 and the Bollinger mid-line at $84 likely to attract dip-buying interest, while deeper declines would look to the Bollinger lower band and the 200-day SMA near $78 as a more significant demand zone.
(The technical analysis of this story was written with the help of an AI tool. Know more.)
WTI Oil FAQs
WTI Oil is a type of Crude Oil sold on international markets. The WTI stands for West Texas Intermediate, one of three major types including Brent and Dubai Crude. WTI is also referred to as “light” and “sweet” because of its relatively low gravity and sulfur content respectively. It is considered a high quality Oil that is easily refined. It is sourced in the United States and distributed via the Cushing hub, which is considered “The Pipeline Crossroads of the World”. It is a benchmark for the Oil market and WTI price is frequently quoted in the media.
Like all assets, supply and demand are the key drivers of WTI Oil price. As such, global growth can be a driver of increased demand and vice versa for weak global growth. Political instability, wars, and sanctions can disrupt supply and impact prices. The decisions of OPEC, a group of major Oil-producing countries, is another key driver of price. The value of the US Dollar influences the price of WTI Crude Oil, since Oil is predominantly traded in US Dollars, thus a weaker US Dollar can make Oil more affordable and vice versa.
The weekly Oil inventory reports published by the American Petroleum Institute (API) and the Energy Information Agency (EIA) impact the price of WTI Oil. Changes in inventories reflect fluctuating supply and demand. If the data shows a drop in inventories it can indicate increased demand, pushing up Oil price. Higher inventories can reflect increased supply, pushing down prices. API’s report is published every Tuesday and EIA’s the day after. Their results are usually similar, falling within 1% of each other 75% of the time. The EIA data is considered more reliable, since it is a government agency.
OPEC (Organization of the Petroleum Exporting Countries) is a group of 12 Oil-producing nations who collectively decide production quotas for member countries at twice-yearly meetings. Their decisions often impact WTI Oil prices. When OPEC decides to lower quotas, it can tighten supply, pushing up Oil prices. When OPEC increases production, it has the opposite effect. OPEC+ refers to an expanded group that includes ten extra non-OPEC members, the most notable of which is Russia.
Recommended Articles


