


Does Gold Futures Trading Above Spot Really Signal a Bullish Market?
Since 2026, gold has remained one of the most closely watched assets in global markets. As prices climb to historic highs, more investors are shifting from spot gold into futures, ETFs, and even leveraged products — and in doing so, running into a question that seems simple but is easy to misunderstand: why does the same ounce of gold have a different price today in the spot market than it does in the futures market months from now?
Many people's first instinct is: if the December gold futures contract is priced higher than today's spot price, doesn't that mean the market expects prices to keep rising by year-end? This explanation feels intuitive, but it isn't quite right.
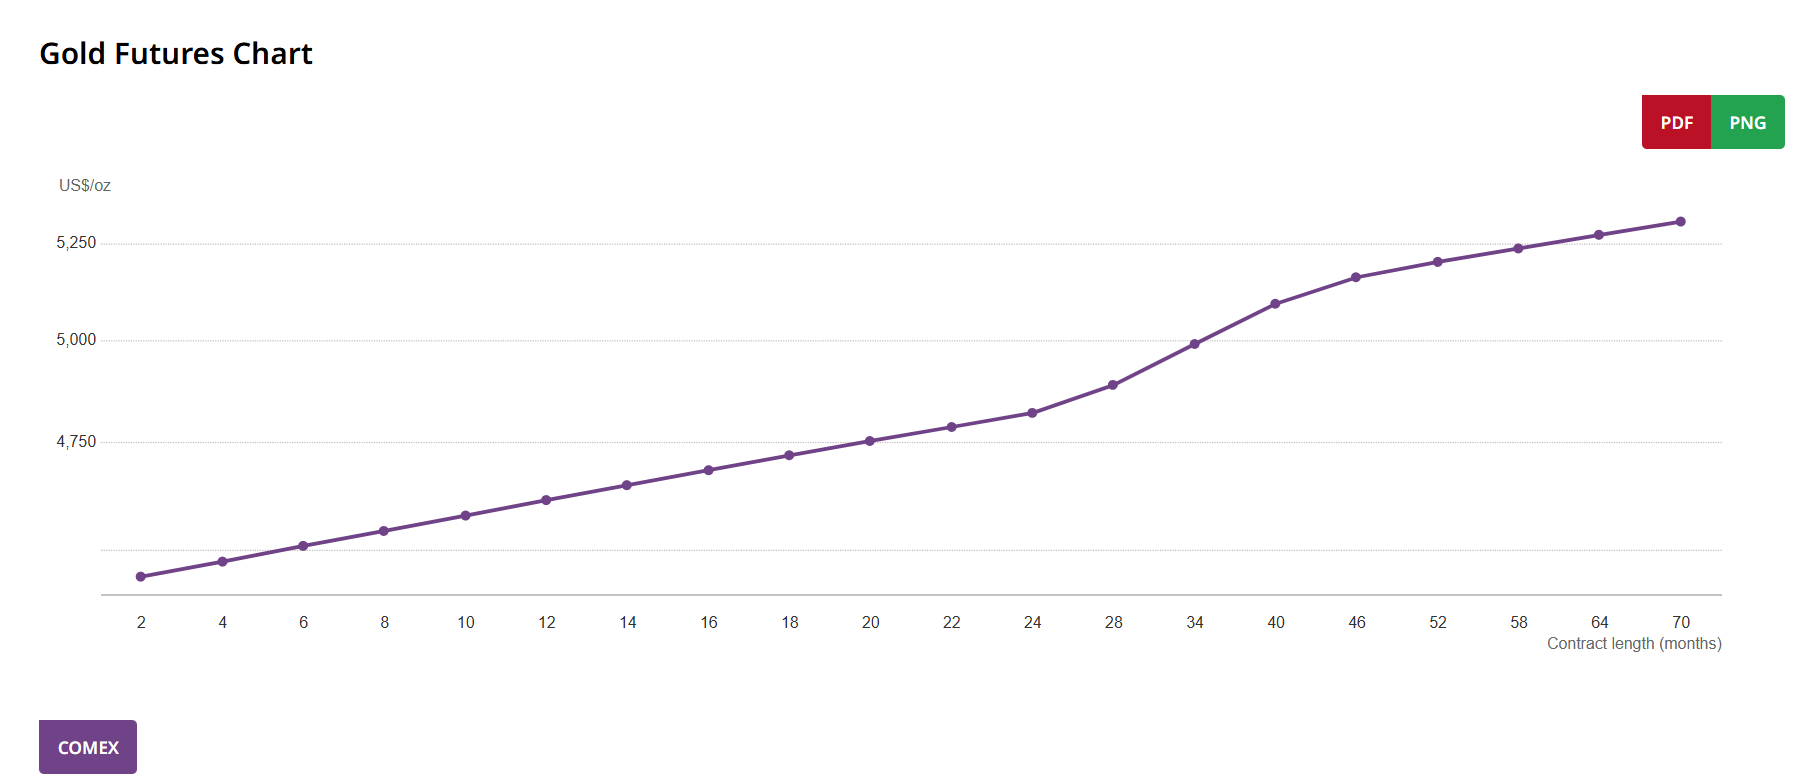
In fact, gold futures trading above spot is a fairly normal market condition. The World Gold Council notes that the gold futures curve typically slopes upward — meaning longer-dated futures prices sit above the spot price — a structure known as contango. As of July 2026, the COMEX gold futures curve still displays this term structure.
Source: World Gold Council
More importantly, a futures price isn't primarily a forecast produced by a panel of professional investors voting on where gold will be. Behind it lies a more fundamental financial logic: money has a cost, holding gold has a cost, and owning gold today is not economically identical to receiving gold in the future.
Understanding this logic matters beyond gold. Futures markets for crude oil, copper, agricultural commodities, stock indices, and even some digital assets are built on similar pricing frameworks. So the question worth understanding isn't whether gold will actually rise to the price shown in the futures curve by year-end, but rather: why does an ounce of gold delivered in the future trade at a different price than an ounce of gold today?
Part One: What's the Difference Between Owning Gold Today and Owning It a Year From Now?
Suppose today's spot price of one ounce of gold is 4,000 US dollars. There are two ways to guarantee you own one ounce of gold a year from now.
The first method is direct: pay 4,000 dollars today, buy the gold, and store it for a year. The second method: buy nothing today, and simply sign a futures or forward contract for delivery of gold one year out.
At first glance, both methods produce the identical outcome — a year from now, you hold one ounce of gold either way. But the economic cost is not the same.
If you spend 4,000 dollars on gold today, that money can no longer sit in a bank, money market fund, or US Treasuries earning interest over the next year. Assuming a risk-free rate of 5%, 4,000 dollars would generate roughly 200 dollars in interest over a year. In other words, holding gold today carries a hidden cost: you give up the return that money could otherwise have earned. This is gold's financing cost, or opportunity cost.
Therefore, all else equal, the theoretical delivery price of gold a year from now should not still be 4,000 dollars. If the one-year gold futures price were also 4,000 dollars, a simple arbitrage opportunity could arise. A trader could: borrow 4,000 dollars; buy one ounce of gold today; simultaneously sell a one-year gold futures contract; and deliver the gold a year later at 4,000 dollars.
The problem is that the borrowed 4,000 dollars must be repaid with interest a year later — roughly 4,200 dollars including principal and interest. So if the future delivery price is only 4,000 dollars, the trade cannot even cover the financing cost. Conversely, under normal conditions, the future delivery price of gold needs to embed this holding cost.
This is one of the most important concepts in commodity futures: cost of carry. For gold, a simplified way to understand it is:
Gold forward price ≈ Spot price + Financing cost + Storage and insurance cost - Additional yield from holding physical gold
CME's own educational materials on gold futures also list financing, storage, and insurance costs as key factors affecting the futures-to-spot price relationship. So when we see a distant futures contract priced above spot, the first thought shouldn't be "Wall Street thinks gold is going up." It should be: "If I buy gold today and hold it until that date, what cost would I incur?" This is the starting point for understanding gold's entire term structure.
Part Two: Why Is Gold Usually in Contango?
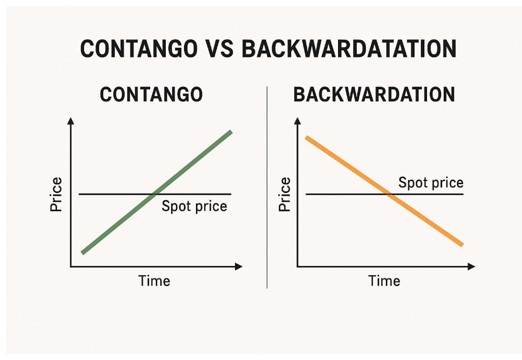
When forward futures prices sit above the spot price, and prices generally rise the further out the maturity, this market structure is called contango. The opposite — when spot trades above forward futures — is called backwardation.
Source: PhysicalGold.com
The World Gold Council notes that contango is the more typical state for gold futures, and one reason is precisely the cost of carry.
Why is gold particularly prone to this? Because gold has one crucial characteristic: it is extremely easy to store. Consider a different commodity — natural gas. If you buy a large batch of natural gas today intending to sell it a year later, you can't simply lock it in a warehouse; natural gas requires specialized storage facilities, and storage capacity itself is quite limited. Crude oil is similar. Grain involves storage, transportation, spoilage, and even decay. For these commodities, the economic value of "owning it today" versus "owning it a year from now" can differ substantially.
Gold is entirely different. A standard gold bar placed in a vault today is the same bar a year later. It doesn't decay, doesn't lose any industrial property from being stored, and carries very high value per unit of volume. This means gold occupies relatively little storage space for its value. The World Gold Council specifically points out that gold's physical storage cost is relatively low compared to commodities like natural gas, so gold's futures curve is typically distorted by storage costs far less than many other commodities.
As a result, gold's term structure tends to resemble that of a financial asset more than that of a physical commodity. One of the clearest factors influencing it is not how much warehouse space remains, but how expensive money is — that is, interest rates. When rates rise, the opportunity cost of buying gold today increases, making a larger theoretical premium of forward over spot more likely. When rates fall, this carry cost shrinks, narrowing the theoretical spread between spot and forward. This is also why gold, despite paying no interest itself, is so deeply tied to interest rates. Many investors know real rates can affect the gold price, but the term structure reveals a more direct relationship: rates are directly embedded in the pricing across gold's different maturities.
Part Three: The Most Common Mistake — Treating Futures Prices as Market Forecasts
This is the single most important point in understanding futures. Suppose spot gold is 4,000 dollars today, and the one-year futures price is 4,160 dollars. It's tempting to say: "the futures market expects gold to rise to 4,160 dollars in a year." Strictly speaking, that statement is inaccurate, because 4,160 dollars may largely just be the no-arbitrage price derived from today's spot price, financing cost, and other carry factors.
Consider an extreme example. Suppose every investor in the market believes gold could fall to 3,500 dollars in a year. That doesn't mean today's one-year futures contract must trade at 3,500 dollars. Why? Because if the one-year contract were pushed far below the level justified by spot and financing cost, arbitrageurs could step in and use combinations of spot, financing, and futures trades to pull the price back. In other words, "what everyone thinks gold will be worth in a year" and "what today's one-year gold contract should be worth" are not the same question. The former is a forecasting question; the latter is fundamentally a pricing question. This is where beginners most often get confused.
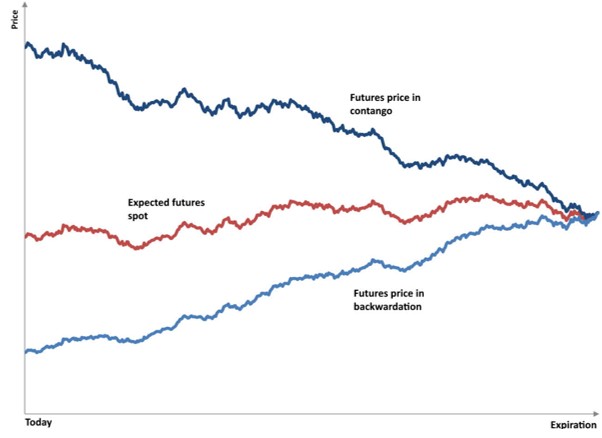
In equity analysis, we often treat prices as reflecting investors' judgment about future cash flows, and it's natural to apply the same logic to futures: "December gold futures at 4,200 dollars means the market forecasts December gold at 4,200 dollars." But futures contracts are not stocks. Futures prices are constrained by the spot price and cost of carry, and that constraint tightens as expiration approaches. CME explicitly states that as a futures contract nears expiration, its price should gradually converge toward the spot price — otherwise an arbitrage opportunity would emerge. This is known as convergence.
Source: Seeking Alpha
Suppose a gold futures contract expires tomorrow. If spot gold is 4,000 dollars today but tomorrow's delivery futures contract is still at 4,500 dollars, an obvious problem arises: a trader could buy gold today and deliver it tomorrow at a much higher price via the futures contract. Arbitrage activity would eventually force the two prices together.
At the moment of actual delivery, "today's gold" and "the gold represented by the futures contract" become the same thing. So the two prices must naturally converge. The longer the maturity, the more pronounced the time value that can exist between spot and futures; the shorter the maturity, the smaller that difference typically becomes.
Part Four: Does Contango Carry No Information at All?
Not quite. If contango doesn't automatically mean the market is bullish, should we ignore the futures curve entirely? The answer is also no.
What actually matters isn't simply "futures > spot," but how much higher or lower the contango is than what would normally be expected. Suppose based on rates and carry costs, one-year gold should theoretically trade about 4% above spot, but the market is only pricing in a 1% premium — that gap itself is worth investigating. Or, under normal conditions gold forwards should trade above spot, but suddenly spot trades above near-month futures. The question then becomes: why are investors willing to pay more for gold delivered now than for gold delivered later?
This brings in another important concept: convenience yield. The name sounds abstract, but the idea is simple — owning the physical commodity right now can carry an extra value of its own. This concept is easiest to grasp with industrial commodities. Suppose an oil refinery needs crude to keep production running. For it, "someone guarantees me oil in three months" is not the same as "I have oil in my storage tank right now." If the supply chain suddenly breaks down, actually holding inventory keeps the refinery running. So physical inventory itself carries an implicit value — this is one expression of convenience yield.
Gold isn't a typical industrial raw material, but a similar mechanism still applies. The World Gold Council's research on gold lending rates notes that when demand for physical gold is especially strong, or supply becomes tight, the convenience yield of holding physical gold can rise; if this yield exceeds financing and storage costs, gold's forward price can fall below spot, producing backwardation. So what's truly worth noting about backwardation isn't that the market is extremely bearish on gold — it may instead mean that owning physical gold right now has become especially valuable. This is exactly why term structure can't simply be used as a directional forecasting tool: the same phenomenon of forward trading below spot may reflect not pessimism, but unusually strong immediate demand in the spot market.
Part Five: Why Doesn't Arbitrage Eliminate All Price Gaps?
This naturally raises another question. Given the clear arbitrage relationship between spot and futures, why doesn't the market price always strictly follow the theoretical formula? The real-world answer is: because real financial markets are never frictionless.
Textbook arbitrage typically assumes: anyone can borrow at the same rate; any quantity of gold can be bought; gold can be transported instantly; storage capacity is unlimited; trading incurs no fees; bid-ask spreads are zero; there's no credit risk; and delivery is always smooth. Reality is nothing like this.
- Financing costs differ substantially across large banks, hedge funds, dealers, and ordinary investors, and even for the same institution, borrowing conditions can shift quickly between calm and stressed periods — so theoretical arbitrage profit may be eaten up entirely by financing costs once actually executed.
- Transaction and storage costs: although gold is easier to store than oil or gas, physical delivery by large institutions still involves transportation, insurance, vaulting, certification, and operational expenses.
- Location matters: a gold bar in New York and one in a London vault are economically close but not interchangeable within a minute — different markets have different delivery specifications, bar sizes, trading systems, storage systems, and even import/export rules, so moving physical gold to meet a sudden regional demand spike takes time even if the rest of the world has plenty of gold.
- Balance-sheet constraints: even a trade that looks arbitrageable on paper requires capital, margin, and risk limits from financial institutions, and periods of greatest market stress are often exactly when balance sheet capacity is scarcest.
As a result, markets frequently show spreads that are wide enough that arbitrage should theoretically occur, yet those with the capability to arbitrage are unwilling or unable to commit sufficient capital. Finance calls this phenomenon limits to arbitrage, and it is key to understanding the gap between real markets and textbook markets. Prices remain constrained by arbitrage relationships, but that doesn't mean prices must sit precisely at some theoretical value at every moment.
Part Six: Why Is Gold More Like Money Than Many Commodities?
Term structure carries another easily overlooked insight: it helps explain why gold is such an unusual commodity. Physically, gold is a metal — it's mined, transported, processed, and stored. But structurally, its market behaves very differently from copper, iron ore, or natural gas.
A core distinction: the vast majority of gold ever mined still exists today. Oil, once extracted, gets burned. Natural gas gets consumed. Grain eventually gets eaten. Copper, once embedded in buildings, power grids, or machinery, rarely returns to the market easily. Gold is different — huge quantities of previously mined gold continue to exist as bars, coins, jewelry, and reserve assets. So the gold market depends not only on how much mines produce this year, but also on whether existing holders are willing to sell their gold back into the market.
This makes gold, economically, more like a financial asset with an enormous existing stockpile. Its term structure is therefore shaped more by interest rates, financing conditions, asset allocation demand, and financial market conditions than by physical supply constraints. Compared with many commodities, the futures curve for gold and other precious metals typically has less impact on long-term investment returns, largely because gold's storage cost is relatively limited. This is also why oil futures analysis focuses heavily on inventories, tank capacity, and immediate supply, while gold futures analysis places far more weight on interest rates and financing costs.
From this angle, gold sits between two worlds — it is both a commodity and something close to a monetary asset, and term structure is exactly where these two properties intersect.
Part Seven: How Should Investors Actually Read the Gold Futures Curve?
With this framework in place, the practical question becomes: what should ordinary investors actually take away from the gold futures curve?
First, the thing to avoid: seeing distant contracts priced above spot and jumping straight to "the market is bullish." Contango by itself carries limited directional meaning, since it's the normal state of affairs. What actually deserves attention is change.
- Watch for shifts in the size of contango: if contracts of a given maturity normally trade at a certain premium to spot and that premium suddenly widens or narrows sharply, ask whether rates have shifted, financing conditions have changed, or something unusual is happening in the gold market itself — the focus here is the relationship between prices, not absolute price levels.
- Watch for the curve flipping from contango to backwardation: since contango is the more typical state for gold, a sudden reversal in a specific maturity segment is usually more worth investigating than "the far month is a bit pricier." It could signal rising immediate physical demand, supply tightness at a specific maturity, unusual conditions in funding markets, or certain participants urgently needing spot gold. Backwardation isn't an automatic buy signal, but it's often a market signal worth questioning.
- Read gold alongside interest rates: since gold futures' carry is inherently tied to financing costs, the futures curve can't be analyzed independent of the rate environment — even with an identical spot price, the "normal" term structure looks very different in a high-rate environment versus a near-zero-rate one. This is a prerequisite question before judging whether any given contango level is unusual.
- Know whether you're actually invested in spot or futures: this matters especially for long-term investors. If an investment product tracks gold by continuously holding and rolling futures contracts, the return an investor ultimately receives may not fully match spot gold's price movement. This is because each roll from an expiring contract to the next may carry a cost or benefit tied to the term structure — known as roll yield. In a persistent contango environment, continually selling a cheaper near-month contract and buying a more expensive far-month contract theoretically generates a rolling cost. For gold, because storage costs are relatively low, the futures curve's impact on long-term returns is usually less extreme than for something like natural gas, but the mechanism still exists. The World Gold Council likewise notes that the shape of the futures curve, combined with continuous contract rolling, can cause futures-based investment returns to diverge from spot gold returns.
So "I'm investing in gold" still leaves open the question of exactly which instrument you're using — spot, physical bullion, ETFs, futures, or other derivatives all track roughly the same gold price, but the costs and risks investors ultimately bear are not identical.
Conclusion: The Real Message in Futures Prices Isn't Where Gold Is Headed
The most common misunderstanding created by the gold futures market is that the prices on screen look far too much like a forecast. Gold is 4,000 dollars today. The six-month contract shows 4,080. The one-year contract shows 4,160. The human brain naturally reads this as a price path into the future.
But once futures are properly understood, this curve turns out to express something far more complex. It embeds the time value of money; storage and insurance costs; the scarcity of spot gold itself; the demand of market participants for physical delivery; and it is also bound by financing conditions, market liquidity, and arbitrage capacity.
So the futures curve is not a Wall Street forecast chart for future gold prices — it is first and foremost a price table describing how value is exchanged between gold today and gold delivered in the future. This is also why contango does not equal bullish, and backwardation does not equal bearish. What's genuinely worth focusing on isn't simply comparing which month's price is higher, but understanding why gold at that particular maturity is worth that price relative to gold today.
Once the question shifts from "how high does the market think gold will go" to "what forces are creating this gap between spot and futures," many concepts that once seemed complicated — interest rates, cost of carry, arbitrage, term structure, roll yield — turn out to be different facets of the same underlying story. And that may be the most important lesson futures markets teach: price doesn't just express investors' directional views — it also reflects the cost of time itself.
Recommended Articles


