


Gold price retreats after reaching all-time high despite falling US yields
- Gold slumps below $2,430, down 0.28% after reaching an all-time high of $2,450.
- US Treasury yields decline with 10-year TIPS yield dropping three basis points to 2.081%.
- Hedge funds increase bullish bets on Gold futures to a three-week high, capping XAU/USD’s losses.
Gold price retraces during Tuesday’s North American session after hitting an all-time high of $2,450. Yet it retreated below the April 12 high of $2,431 as the Greenback recovers some ground. A scarce economic docket keeps traders leaning on Fedspeak, which remained cautious of signaling the beginning of rate cuts.
The XAU/USD trades at $2,418, down 0.28% after reaching a high of $2,433. Wall Street indices remain in the green, a headwind for the safe-haven status for the golden metal. Even though it’s sought as a “hedge” for inflation, investors seem reluctant to give away profits from the US stock market.
Additionally, officials of the Federal Reserve (Fed) continued to cross the wires and adhere to its stance of keeping interest rates on hold until the disinflationary process evolves.
Despite that, US Treasury bond yields edged lower. The US 10-year benchmark note dropped three-and-a-half basis points to 4.41%, while the 10-year yield on the Treasury Inflation-Protected Securities (TIPS), which correlates inversely to Gold prices, dropped three basis points to 2.081%.
Data from the Commodities Futures Trading Commission (CFTC) showed that hedge funds boosted bullish bets on Gold futures to a three-week high in the week ending May 14.
The US economic docket during the week before the latest Fed meeting minutes was released on Wednesday. On Thursday, US Initial Jobless Claims are expected to show the labor market is cooling, along with the Chicago Fed National Activity Index.
Daily digest market movers: Gold price falls despite falling US yields following hawkish Fed comments
- Gold price retreats amid falling US Treasury yields and a weaker US Dollar. The US Dollar Index (DXY), which tracks the Greenback’s performance against a basket of six other currencies, is virtually unchanged at 104.64, putting a lid on XAU/USD prices.
- Last week’s inflation data showed that underlying prices are easing. That reignited traders' expectations that the US central bank would resume easing policy. However, they must be cautious as Fed officials pushed back against just one reading that inflation is moderating.
- Atlanta Fed President Raphael Bostic stated that he is not in a hurry to reduce interest rates and prefers to keep them steady, emphasizing that the Fed's top priority is still addressing inflation.
- Fed Governor Christopher Waller acknowledged that April’s CPI showed progress but mentioned that he needs to see several months of favorable inflation data before he can support a rate cut. Meanwhile, Michael Barr, the vice-chair of supervision, remarked, "We still need to finish the job on inflation."
- On Monday, Vice-Chair Philip Jefferson said it’s too easy to tell when the disinflation process will resume while stating that the policy rate is restrictive. Cleveland Fed President Loretta Mester stated that inflation risks are tilted to the upside.
- Data from the Chicago Board of Trade shows investors are expecting 35 basis points of Fed easing toward the end of the year.
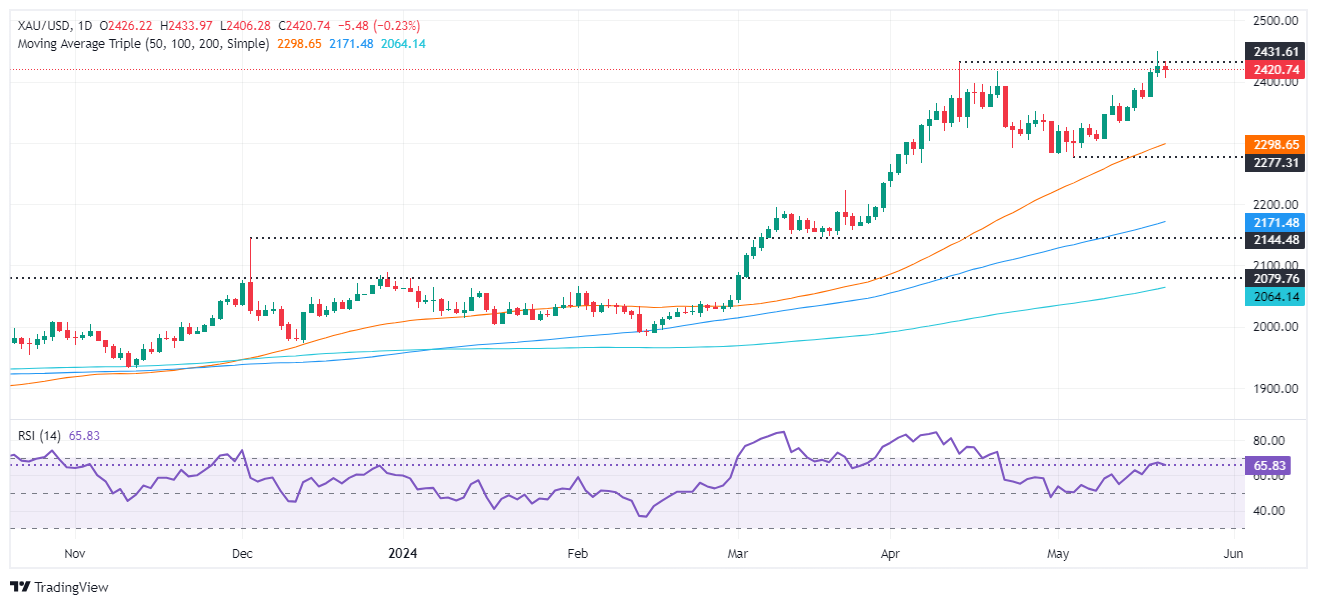
Technical analysis: Gold price slides below $2,450 as bears target $2,400
Gold’s uptrend remains intact, but a daily close below the May 20 low of $2,407 could pave the way for a pullback. That event could form a ‘dark cloud cover,’ a two-candle chart pattern that implies the XAU/USD can print a leg down before extending its rally.
Momentum is on the back of buyers as depicted by the Relative Strength Index (RSI) in bullish territory. However, the RSI is aiming lower, and once it clears the 50-midline, look for further declines.
On the upside, XAU/USD's first resistance would be the April 12 high of $2,431, followed by the all-time high of $2,450.
Conversely, if XAU/USD retreats below $2,400, that could expose the May 13 low at $2,332, followed by the May 8 low of $2,303. Once those levels are surpassed, the 50-day Simple Moving Average (SMA) at $2,284 will be up next.
Gold FAQs
Gold has played a key role in human’s history as it has been widely used as a store of value and medium of exchange. Currently, apart from its shine and usage for jewelry, the precious metal is widely seen as a safe-haven asset, meaning that it is considered a good investment during turbulent times. Gold is also widely seen as a hedge against inflation and against depreciating currencies as it doesn’t rely on any specific issuer or government.
Central banks are the biggest Gold holders. In their aim to support their currencies in turbulent times, central banks tend to diversify their reserves and buy Gold to improve the perceived strength of the economy and the currency. High Gold reserves can be a source of trust for a country’s solvency. Central banks added 1,136 tonnes of Gold worth around $70 billion to their reserves in 2022, according to data from the World Gold Council. This is the highest yearly purchase since records began. Central banks from emerging economies such as China, India and Turkey are quickly increasing their Gold reserves.
Gold has an inverse correlation with the US Dollar and US Treasuries, which are both major reserve and safe-haven assets. When the Dollar depreciates, Gold tends to rise, enabling investors and central banks to diversify their assets in turbulent times. Gold is also inversely correlated with risk assets. A rally in the stock market tends to weaken Gold price, while sell-offs in riskier markets tend to favor the precious metal.
The price can move due to a wide range of factors. Geopolitical instability or fears of a deep recession can quickly make Gold price escalate due to its safe-haven status. As a yield-less asset, Gold tends to rise with lower interest rates, while higher cost of money usually weighs down on the yellow metal. Still, most moves depend on how the US Dollar (USD) behaves as the asset is priced in dollars (XAU/USD). A strong Dollar tends to keep the price of Gold controlled, whereas a weaker Dollar is likely to push Gold prices up.
Recommended Articles


