

Gold holds steady in a narrow range ahead of US CPI data

Source Fxstreet
  • Gold trades within a narrow range ahead of US CPI data.
  • Economists expect inflation to rise, reflecting the impact of higher Oil prices.
  • Technically, XAU/USD consolidates within a rising channel below the 200-SMA on the 4-hour chart.

Gold (XAU/USD) oscillates within a narrow range on Friday as markets continue to monitor the evolving situation in the Middle East, while traders also stay on the sidelines ahead of US inflation data. At the time of writing, XAU/USD is trading around $4,762 and is on track for a third straight weekly gain.

Some improvement in risk sentiment has been seen after US President Donald Trump told NBC News on Thursday that he was “very optimistic” a peace deal with Iran was within reach following the two-week ceasefire agreement. Meanwhile, Israeli Prime Minister Benjamin Netanyahu said his country would begin direct talks with Lebanon “as soon as possible.”

These developments have helped ease earlier concerns about the durability of the ceasefire. However, tensions remain elevated as Israeli strikes continue in Lebanon, keeping markets cautious ahead of upcoming US-Iran negotiations in Pakistan.

Against this backdrop, Gold's price action remains driven by geopolitical headlines and shifting expectations for Federal Reserve (Fed) interest rates. Although Oil prices have eased since the ceasefire announcement, they remain well above pre-conflict levels as shipping through the Strait of Hormuz remains largely disrupted.

This keeps inflation concerns alive, with the upcoming Consumer Price Index (CPI) data expected to reflect the impact of higher Oil prices. Economists forecast headline CPI to rise by 0.9% MoM in March, up from 0.3% the previous month, while annual inflation is seen accelerating to 3.3% from 2.4% in February.

Fed policymakers have repeatedly highlighted that both sides of the dual mandate are at risk, with the disinflation process slowing while labor market conditions show signs of strain. In this context, Oil-driven inflation is likely to keep the Fed on hold in the coming months, unless a meaningful breakthrough in US-Iran talks leads to a sustained decline in Oil prices.

Technical analysis: XAU/USD consolidates within a rising channel
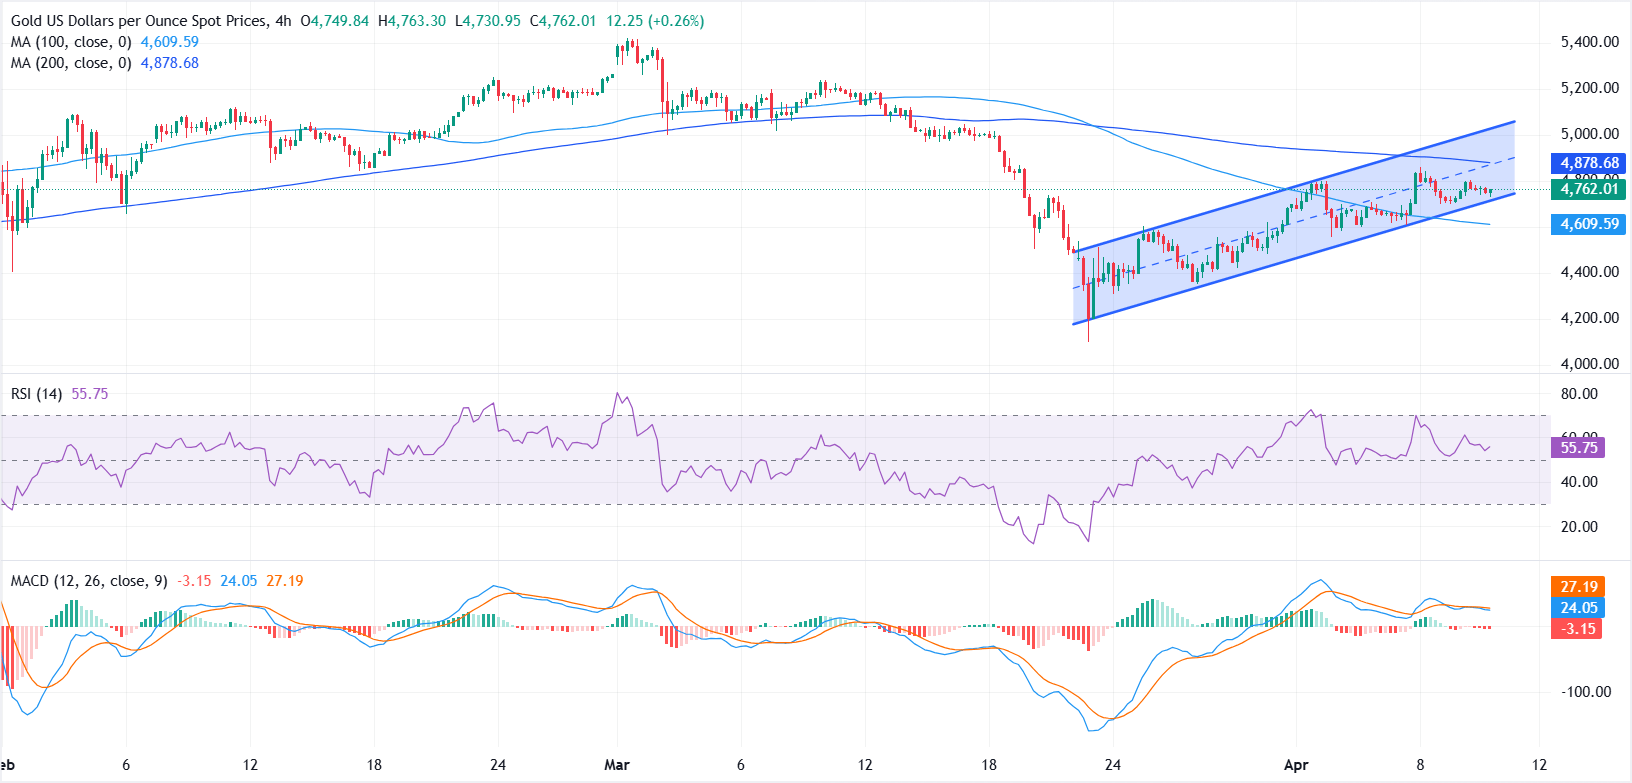
From a technical perspective, the 4-hour chart shows XAU/USD trading within an upward-sloping parallel channel, forming a series of higher highs and higher lows since bottoming near the $4,100 March swing low.

However, price action reflects a neutral-to-capped near-term tone, as the pair trades below the 200-period Simple Moving Average (SMA) at $4,878 while holding above the 100-period SMA at $4,609. This setup points to a consolidative phase within the channel.

The Relative Strength Index (RSI) around 55 hints at mildly positive momentum, yet the Moving Average Convergence Divergence (MACD) line remains below the signal line and above zero, with negative histogram bars holding, reinforcing a waning upside impulse and the risk of a corrective pullback while below the 200-period SMA.

On the topside, immediate resistance is defined first by the 200-period SMA at $4,878, with a break higher opening the way toward the channel’s upper boundary near $5,000 as the next significant supply zone.

On the downside, initial demand emerges around the channel bottom at $4,700, which guards more substantive support at the 100-period SMA at $4,609. A sustained move below the latter would weaken the broader constructive channel narrative and expose deeper losses, while holding above these supports would keep the current consolidation phase intact inside the rising structure.

(The technical analysis of this story was written with the help of an AI tool.)


Disclaimer: For information purposes only. Past performance is not indicative of future results.
placeholder
Gold Price Analysis Today | Forex Gold Analysis | XAU/USD Analysis - November 11, 2026Get the latest gold price analysis, forex gold insights, and XAU/USD analysis for November 11, 2026. Read on for the details.
Author  Mitrade
Nov 11, Wed
Get the latest gold price analysis, forex gold insights, and XAU/USD analysis for November 11, 2026. Read on for the details.
placeholder
Bitcoin lost its 200-day average — but the exit started three sessions before the CPIBitcoin fell 2.5% to about $73,400 on 11 November, an 11-week low, breaking its 200-day moving average near $73,100. The 24-hour liquidation tally reached $632 to $705 million, roughly 82% of it longs. But spot ETF outflows began three sessions earlier and USDT's market cap has shrunk $6.6 billion in 60 days — the leveraged length left before the inflation print did. A double top at 81,890 and 81,080 leaves a measured target of 69,366.
Author  Suzie
Nov 11, Wed
Bitcoin fell 2.5% to about $73,400 on 11 November, an 11-week low, breaking its 200-day moving average near $73,100. The 24-hour liquidation tally reached $632 to $705 million, roughly 82% of it longs. But spot ETF outflows began three sessions earlier and USDT's market cap has shrunk $6.6 billion in 60 days — the leveraged length left before the inflation print did. A double top at 81,890 and 81,080 leaves a measured target of 69,366.
placeholder
Nvidia slid 7.7% after hours while AMD and Broadcom rose — the AI trade changed hands, it didn't breakNvidia closed Wednesday at 173.73, up 2.87%, then fell as much as 8.1% to 159.44 after reports that its board was preparing for a possible leadership change. The same session, the Philadelphia Semiconductor Index rose 5.7% with all 30 components higher, CoreWeave jumped 24.7% on 168% revenue growth, and Micron added 11.9%. If AI demand were being repriced, AMD and Broadcom would not be bid. This is a governance discount on one name, and 204.54 — the 200-day average — is the level that settles it.
Author  Irene Q.
Nov 12, Thu
Nvidia closed Wednesday at 173.73, up 2.87%, then fell as much as 8.1% to 159.44 after reports that its board was preparing for a possible leadership change. The same session, the Philadelphia Semiconductor Index rose 5.7% with all 30 components higher, CoreWeave jumped 24.7% on 168% revenue growth, and Micron added 11.9%. If AI demand were being repriced, AMD and Broadcom would not be bid. This is a governance discount on one name, and 204.54 — the 200-day average — is the level that settles it.
placeholder
Gold hit a one-year low while central banks bought 321 tonnes — the sellers were never the ones you thinkSpot gold closed at 3,876 on Thursday, down 2.8% and its lowest close in more than a year, with an intraday low near 3,852. The dollar is at a 19-month high of 103.21 and the 10-year yield is at 5.10%, so the price move is easy to explain. What is harder to explain is who sold: central banks bought 321 tonnes in Q3, the PBoC added for a 24th straight month, ETF holdings are near a record 4,256 tonnes, and roughly 95% of the futures selling came from non-reportable and sovereign-type accounts rather than hedge funds. This piece separates the two books that have to balance.
Author  Irene Q.
Yesterday 02: 40
Spot gold closed at 3,876 on Thursday, down 2.8% and its lowest close in more than a year, with an intraday low near 3,852. The dollar is at a 19-month high of 103.21 and the 10-year yield is at 5.10%, so the price move is easy to explain. What is harder to explain is who sold: central banks bought 321 tonnes in Q3, the PBoC added for a 24th straight month, ETF holdings are near a record 4,256 tonnes, and roughly 95% of the futures selling came from non-reportable and sovereign-type accounts rather than hedge funds. This piece separates the two books that have to balance.
placeholder
Brent rose 3.3% and US crude stocks built 4.66 million barrels in the same weekBrent January settled at 95.82, up 3.3%, and WTI at 88.74, up 2.55%, after the US signalled it would not pursue a deal with Iran and attacks on Gulf shipping continued. In the same week, EIA data showed US crude inventories rising 4.657 million barrels against expectations of a 1.1 million draw, with gasoline up another 1.799 million. OPEC output also rebounded 1.96 million barrels a day to 27.16 million in October, led by Saudi Arabia at 10.56 million. This piece separates the geopolitical premium from the physical balance and lays out where each side of the trade is anchored.
Author  Irene Q.
Yesterday 03: 06
Brent January settled at 95.82, up 3.3%, and WTI at 88.74, up 2.55%, after the US signalled it would not pursue a deal with Iran and attacks on Gulf shipping continued. In the same week, EIA data showed US crude inventories rising 4.657 million barrels against expectations of a 1.1 million draw, with gasoline up another 1.799 million. OPEC output also rebounded 1.96 million barrels a day to 27.16 million in October, led by Saudi Arabia at 10.56 million. This piece separates the geopolitical premium from the physical balance and lays out where each side of the trade is anchored.
Related Instrument
goTop
quote