Gold Price Forecast: XAU/USD corrects slightly to near $4,320 ahead of US inflation data

Source Fxstreet
  • Gold price retraces to near $4,320 ahead of the US CPI data for November.
  • The US Dollar trades higher in the countdown to the inflation data.
  • The Fed is unlikely to cut interest rates in January, the CME FedWatch tool shows.

Gold price (XAU/USD) trades 0.4% lower to near $4,320 during the European trading session on Thursday, though it remains close to its all-time high of $4,381. The precious metal faces slight pressure as the US Dollar (USD) trades higher ahead of the United States (US) Consumer Price Index (CPI) data for November, which will be published at 13:30 GMT.

During the press time, the US Dollar Index (DXY), which tracks the Greenback’s value against six major currencies, is up 0.15% to near 98.55.

Technically, a higher US Dollar makes the Gold price an expensive bet for investors.

Market participants will closely monitor the US inflation data as it will influence market expectations for the Federal Reserve’s (Fed) monetary policy outlook. The US headline inflation is expected to have accelerated to 3.1% YoY from 3% in October, with CPI ex Food and Energy remaining steady at 3%.

Signs of price pressures remaining sticky would weigh on dovish Fed expectations, while soft figures would boost them.

Theoretically, the Gold price outperforms in a high-inflation environment, but the scenario of fading Fed dovish speculation bodes poorly for non-yielding assets.

Currently, the CME FedWatch tool shows that the probability of the Fed reducing interest rates by 25 basis points (bps) to 3.25%-3.50% in the January meeting is 24.4%.

Gold technical analysis

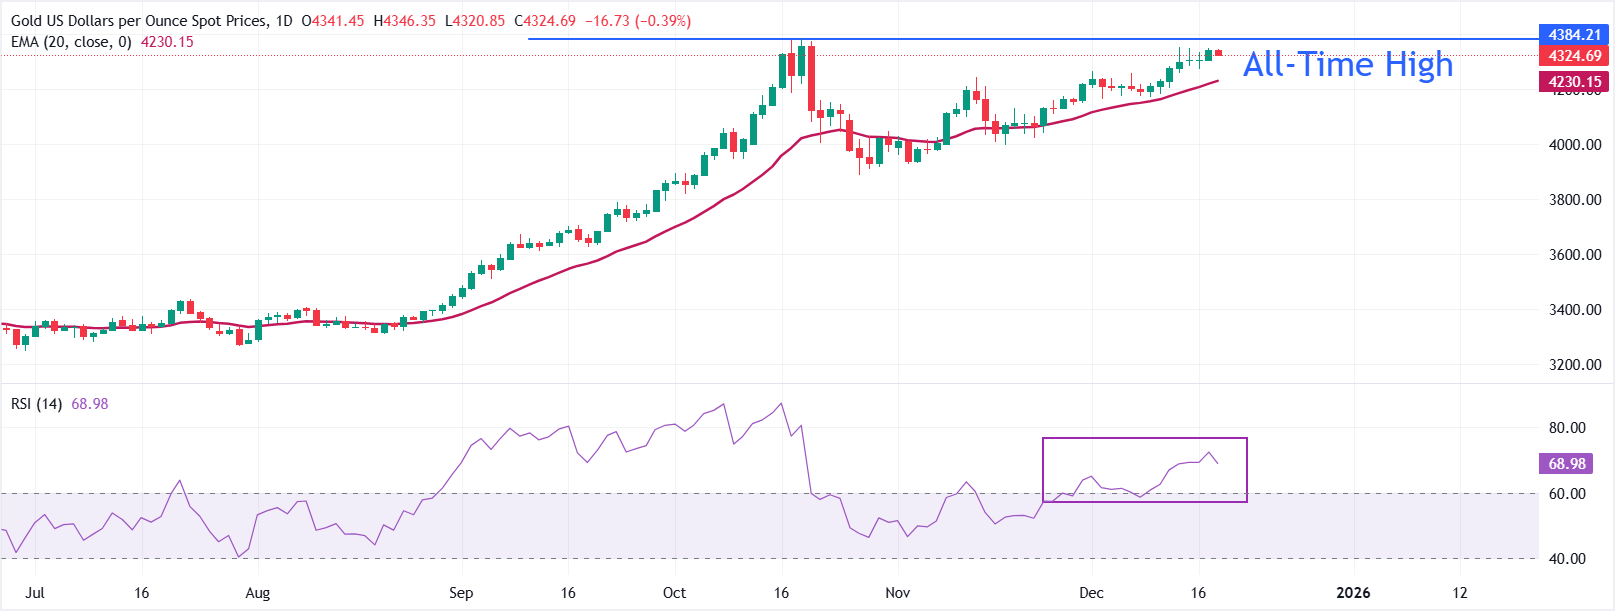
Gold price trades lower to near $4,324.56 on Thursday. The price stands firmly above the rising 20-day Exponential Moving Average (EMA), now at $4,230.13, as the average continues to advance steadily, confirming an upside bias. The widening spread between spot and the EMA underscores trend strength.

The 14-day Relative Strength Index (RSI) at 68.96 sits just below overbought after easing from 72.44, indicating robust but cooling momentum.

Should buyers keep price action anchored above the rising average, the path of least resistance would remain higher, though momentum could pause while RSI cools from the high-60s area. A pullback toward the 20-day EMA at $4,230.13 would meet initial trend support, while sustained closes above the short-term mean would preserve upside extension. RSI near 70 warns of stretched conditions, so shallow dips could emerge before trend continuation.

(The technical analysis of this story was written with the help of an AI tool.)

Gold FAQs

Gold has played a key role in human’s history as it has been widely used as a store of value and medium of exchange. Currently, apart from its shine and usage for jewelry, the precious metal is widely seen as a safe-haven asset, meaning that it is considered a good investment during turbulent times. Gold is also widely seen as a hedge against inflation and against depreciating currencies as it doesn’t rely on any specific issuer or government.

Central banks are the biggest Gold holders. In their aim to support their currencies in turbulent times, central banks tend to diversify their reserves and buy Gold to improve the perceived strength of the economy and the currency. High Gold reserves can be a source of trust for a country’s solvency. Central banks added 1,136 tonnes of Gold worth around $70 billion to their reserves in 2022, according to data from the World Gold Council. This is the highest yearly purchase since records began. Central banks from emerging economies such as China, India and Turkey are quickly increasing their Gold reserves.

Gold has an inverse correlation with the US Dollar and US Treasuries, which are both major reserve and safe-haven assets. When the Dollar depreciates, Gold tends to rise, enabling investors and central banks to diversify their assets in turbulent times. Gold is also inversely correlated with risk assets. A rally in the stock market tends to weaken Gold price, while sell-offs in riskier markets tend to favor the precious metal.

The price can move due to a wide range of factors. Geopolitical instability or fears of a deep recession can quickly make Gold price escalate due to its safe-haven status. As a yield-less asset, Gold tends to rise with lower interest rates, while higher cost of money usually weighs down on the yellow metal. Still, most moves depend on how the US Dollar (USD) behaves as the asset is priced in dollars (XAU/USD). A strong Dollar tends to keep the price of Gold controlled, whereas a weaker Dollar is likely to push Gold prices up.

Disclaimer: For information purposes only. Past performance is not indicative of future results.
placeholder
Ethereum Price Slips Lower — $3,000 Looms as the Key BattlegroundEthereum is attempting to recover from a $3,026 low but remains below $3,200 and the 100-hour SMA, with a bearish trend line near $3,175 capping rebounds as bulls need a clean break above $3,200 to target $3,250–$3,400, while a drop below $3,050 risks a retest of $3,000 and $2,940.
Author  Mitrade
Dec 15, Mon
Ethereum is attempting to recover from a $3,026 low but remains below $3,200 and the 100-hour SMA, with a bearish trend line near $3,175 capping rebounds as bulls need a clean break above $3,200 to target $3,250–$3,400, while a drop below $3,050 risks a retest of $3,000 and $2,940.
placeholder
Bitcoin Slides 5% as Sellers Lean In — Can BTC Reclaim $88,000?Bitcoin has dropped back below $88,000 after rolling over from $90,500, with price still trading under the 100-hour Simple Moving Average. The sell-off found a floor at $85,151, and BTC is now consolidating near that base, but rebounds are facing pressure from a bearish trend line around $89,000. Bulls need to retake $88,000–$89,000 to ease downside risk; failure to do so keeps $85,500–$85,000 and then $83,500 in play, with $80,000 as the deeper “line in the sand.” Bitcoin (BTC) is back in damage-control mode after a sharp pullback wiped out recent gains. The price failed to reclaim the $90,000–$90,500 band, rolled over, and slid through $88,500 before briefly dipping under $87,000. Buyers did show up around $85,000, but the rebound so far looks more like stabilization than a clear trend reversal. Bitcoin dips hard, finds a bid near $85,000(h3) BTC’s latest move lower began when it couldn’t build follow-through above $90,000 and $90,500. Once that upside stalled, sellers took control and pushed price down through $88,500. The slide accelerated enough to spike below $87,000, but the market didn’t free-fall. Bulls defended the $85,000 zone, printing a low at $85,151. Since then, Bitcoin has been consolidating below the 23.6% Fibonacci retracement of the drop from the $93,560 swing high to the $85,151 low — a clue that the bounce is still shallow and that sellers haven’t fully backed off yet. Structurally, BTC is still on the back foot: It’s trading below $88,000, and It remains below the 100-hour Simple Moving Average, keeping short-term trend pressure pointed downward. Resistance is layered, and $89,000 is the problem area(h3) If bulls try to turn this into a recovery, they’ll have to climb through multiple ceilings in quick succession. First, BTC faces resistance around $87,150, followed by a more meaningful barrier near $87,500. From there, the market’s attention snaps back to $88,000 — the level BTC just lost and now needs to reclaim. A close back above $88,000 would improve the tone, but it doesn’t solve the bigger issue: there’s a bearish trend line on the hourly BTC/USD chart (Kraken feed) with resistance near $89,000, which also lines up with the next technical hurdle. If BTC can push through $89,000 and hold, the rebound could extend toward $90,000, with follow-through targets at $91,000 and $91,500. But until price clears that $88,000–$89,000 zone, rallies are at risk of being sold rather than chased. If BTC fails to reclaim resistance, the downside path is clear(h3) The near-term bear case is simple: if Bitcoin can’t climb back above the $87,000 area and keep traction, sellers may attempt another leg lower. Support levels line up like this: Immediate support: $85,500 First major support: $85,000 Next support: $83,500 Then $82,500 in the near term Below that, the major “don’t break this” level is still $80,000. If BTC slips under $80,000, the risk of acceleration to the downside increases significantly — not because it’s magic, but because it’s the kind of psychological and structural level that tends to trigger forced de-risking. Indicators: momentum still leans bearish(h3) The intraday indicators aren’t offering much comfort yet: Hourly MACD is losing pace in the bearish zone. Hourly RSI remains below 50, suggesting sellers still have the upper hand on short timeframes. So while the $85,000 defense held for now, the market hasn’t flipped bullish — it’s just stopped bleeding.
Author  Mitrade
Dec 16, Tue
Bitcoin has dropped back below $88,000 after rolling over from $90,500, with price still trading under the 100-hour Simple Moving Average. The sell-off found a floor at $85,151, and BTC is now consolidating near that base, but rebounds are facing pressure from a bearish trend line around $89,000. Bulls need to retake $88,000–$89,000 to ease downside risk; failure to do so keeps $85,500–$85,000 and then $83,500 in play, with $80,000 as the deeper “line in the sand.” Bitcoin (BTC) is back in damage-control mode after a sharp pullback wiped out recent gains. The price failed to reclaim the $90,000–$90,500 band, rolled over, and slid through $88,500 before briefly dipping under $87,000. Buyers did show up around $85,000, but the rebound so far looks more like stabilization than a clear trend reversal. Bitcoin dips hard, finds a bid near $85,000(h3) BTC’s latest move lower began when it couldn’t build follow-through above $90,000 and $90,500. Once that upside stalled, sellers took control and pushed price down through $88,500. The slide accelerated enough to spike below $87,000, but the market didn’t free-fall. Bulls defended the $85,000 zone, printing a low at $85,151. Since then, Bitcoin has been consolidating below the 23.6% Fibonacci retracement of the drop from the $93,560 swing high to the $85,151 low — a clue that the bounce is still shallow and that sellers haven’t fully backed off yet. Structurally, BTC is still on the back foot: It’s trading below $88,000, and It remains below the 100-hour Simple Moving Average, keeping short-term trend pressure pointed downward. Resistance is layered, and $89,000 is the problem area(h3) If bulls try to turn this into a recovery, they’ll have to climb through multiple ceilings in quick succession. First, BTC faces resistance around $87,150, followed by a more meaningful barrier near $87,500. From there, the market’s attention snaps back to $88,000 — the level BTC just lost and now needs to reclaim. A close back above $88,000 would improve the tone, but it doesn’t solve the bigger issue: there’s a bearish trend line on the hourly BTC/USD chart (Kraken feed) with resistance near $89,000, which also lines up with the next technical hurdle. If BTC can push through $89,000 and hold, the rebound could extend toward $90,000, with follow-through targets at $91,000 and $91,500. But until price clears that $88,000–$89,000 zone, rallies are at risk of being sold rather than chased. If BTC fails to reclaim resistance, the downside path is clear(h3) The near-term bear case is simple: if Bitcoin can’t climb back above the $87,000 area and keep traction, sellers may attempt another leg lower. Support levels line up like this: Immediate support: $85,500 First major support: $85,000 Next support: $83,500 Then $82,500 in the near term Below that, the major “don’t break this” level is still $80,000. If BTC slips under $80,000, the risk of acceleration to the downside increases significantly — not because it’s magic, but because it’s the kind of psychological and structural level that tends to trigger forced de-risking. Indicators: momentum still leans bearish(h3) The intraday indicators aren’t offering much comfort yet: Hourly MACD is losing pace in the bearish zone. Hourly RSI remains below 50, suggesting sellers still have the upper hand on short timeframes. So while the $85,000 defense held for now, the market hasn’t flipped bullish — it’s just stopped bleeding.
placeholder
December Santa Claus Rally: New highs in sight for US and European stocks?Historical data show a rising trend of US and European stocks in December. If the momentum is strong, fund managers may rush in with a buying frenzy.
Author  Mitrade
Yesterday 02: 50
Historical data show a rising trend of US and European stocks in December. If the momentum is strong, fund managers may rush in with a buying frenzy.
placeholder
XRP’s Price Action Flashes a Warning Even as ETF Flows Stay PositiveXRP’s structure remains weak despite 18 straight positive closes in spot XRP ETFs, with analysts warning that $1.98 and other nearby resistance zones could cap rebounds unless the YO region is reclaimed, while deeper downside scenarios keep $1.53 on watch as a potential (not guaranteed) accumulation area.
Author  Mitrade
Yesterday 06: 37
XRP’s structure remains weak despite 18 straight positive closes in spot XRP ETFs, with analysts warning that $1.98 and other nearby resistance zones could cap rebounds unless the YO region is reclaimed, while deeper downside scenarios keep $1.53 on watch as a potential (not guaranteed) accumulation area.
placeholder
Gold declines on profit-taking, USD strength ahead of US CPI releaseGold price (XAU/USD) edges lower below $4,350 during the Asian trading hours on Thursday. The precious metal retreats from seven-week highs amid some profit-taking and a rebound in the US Dollar (USD).
Author  FXStreet
4 hours ago
Gold price (XAU/USD) edges lower below $4,350 during the Asian trading hours on Thursday. The precious metal retreats from seven-week highs amid some profit-taking and a rebound in the US Dollar (USD).
goTop
quote