

Oil dips as massive surge in US inventories offsets bullish sentiment
- WTI Oil retreats below $82 on hefty increase in US crude stockpiles.
- Oil traders remain bullish, but the US stockpile build-up is difficult to ignore.
- The US Dollar Index trades above 104.00 and sees US Dollar bulls digging in their heels.
Oil prices are retreating on Wednesday, with traders gasping for air after seeing the overnight print from the American Petroleum Institute (API), which saw a massive 9.337 million build-up in US stockpiles. A number not to ignore as it means that current production cuts from OPEC could be proven insufficient to keep prices well supported. Meanwhile, commodity analyst Natasha Kaneva from JP Morgan said that Brent futures could jump to $100 after Russia recently asked producers to limit their production in order to comply with OPEC+ production cut agreements.
The US Dollar, meanwhile, is in calm water and steady above 104.00 when measured by the US Dollar Index (DXY). Traders are building a fortress above 104.00 in order to defend the level ahead of the US Gross Domestic Product numbers on Thursday and the Personal Consumption Expenditures (PCE) Price Index on Friday. With the market expectations building up towards an upbeat PCE print, markets could see the US Dollar rally into the weekend as investors tune down the number of interest-rate cuts for 2024.
Crude Oil (WTI) trades at $80.83 per barrel, and Brent Oil trades at $85.29 per barrel at the time of writing.
Oil news and market movers: Bullish sentiment gets crushed
- The US API reported a surprise build of 9.337 million barrels from a drawdown to 1.519 million barrels a week earlier.
- This Wednesday, at 14:30 GMT, the US Energy Information Administration will release its stockpile change, with expectations for a drawdown of 1.275 million barrels.
- Bloomberg reports that Libya has appointed Khalifa Abdul Sadiq as interim oil minister, replacing Mohamed Oun. Oun got suspended pending an investigation after possible violations that led to neglecting the rights of the Libyan State, circumventing the law and wasting public money.
- Oil could see further gains if OPEC+ prolongs current production cuts until possibly the end of 2024.
Oil Technical Analysis: Holding for now
Oil prices are retreating a touch after the staggering build-up in US stockpile numbers. This takes out the wind for Russia, which tried to push oil prices higher by limiting its oil production recently ahead of the OPEC+ meeting next week. The ball is in OPEC’s court now, with the possibility of prolonging current production cuts on the table.
Oil bulls will see $86 appearing as the next cap. Further up, $86.90 follows suit before targeting $89.64 and $93.98 as top levels.
On the downside, both $80.00 and $80.60 should be acting as support with the 200-day Simple Moving Average (SMA) as the level to catch any falling knives near $78.55. The 100-day and the 55-day SMA’s are near $75.64 and $77.15, respectively. Add the pivotal level near $75.27, and it looks like the downside is very limited and well-equipped to resist the selling pressure.
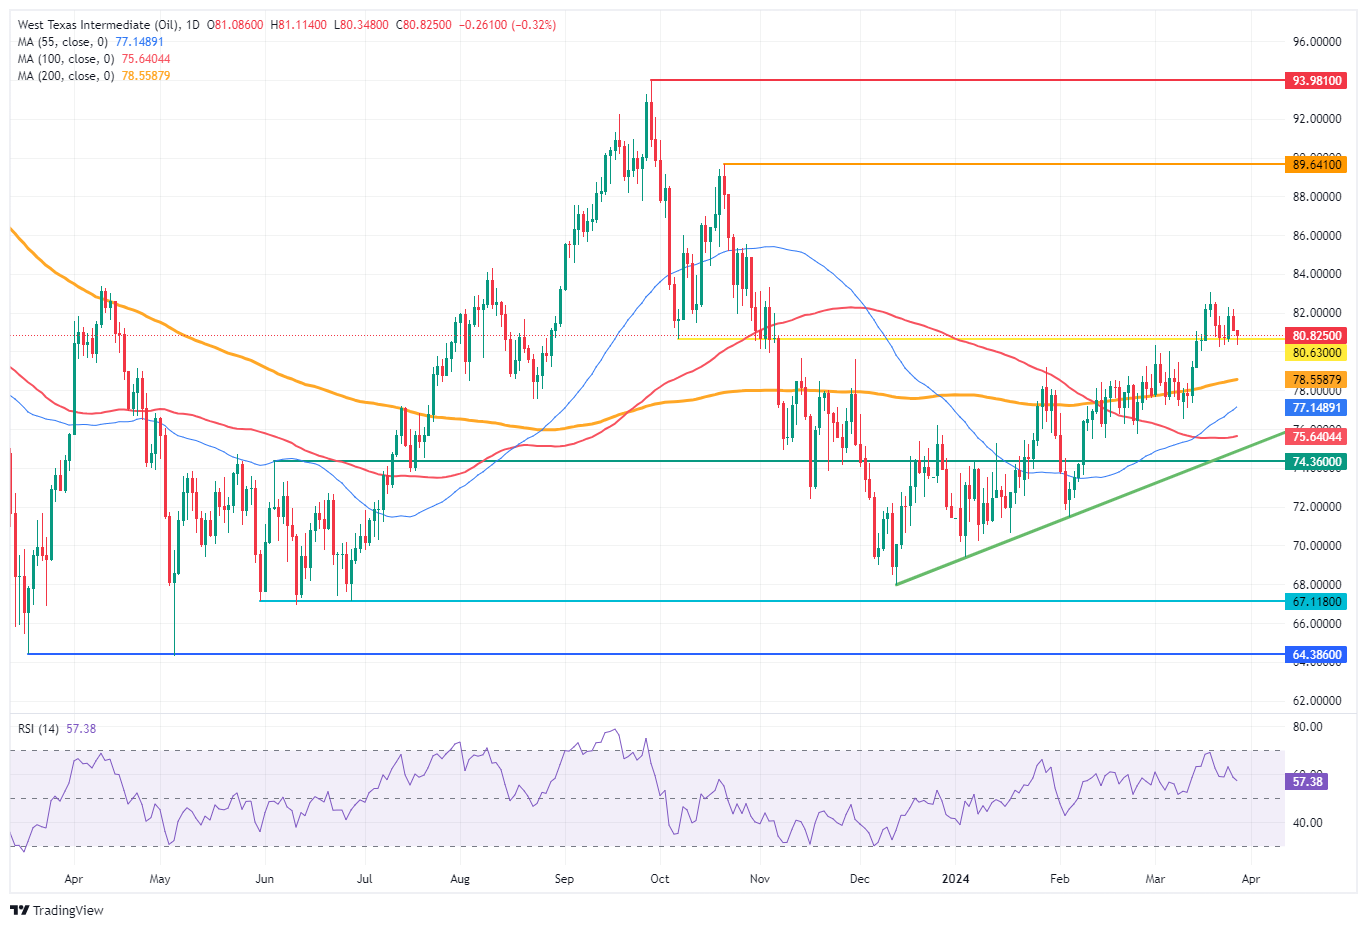
US WTI Crude Oil: Daily Chart
WTI Oil FAQs
WTI Oil is a type of Crude Oil sold on international markets. The WTI stands for West Texas Intermediate, one of three major types including Brent and Dubai Crude. WTI is also referred to as “light” and “sweet” because of its relatively low gravity and sulfur content respectively. It is considered a high quality Oil that is easily refined. It is sourced in the United States and distributed via the Cushing hub, which is considered “The Pipeline Crossroads of the World”. It is a benchmark for the Oil market and WTI price is frequently quoted in the media.
Like all assets, supply and demand are the key drivers of WTI Oil price. As such, global growth can be a driver of increased demand and vice versa for weak global growth. Political instability, wars, and sanctions can disrupt supply and impact prices. The decisions of OPEC, a group of major Oil-producing countries, is another key driver of price. The value of the US Dollar influences the price of WTI Crude Oil, since Oil is predominantly traded in US Dollars, thus a weaker US Dollar can make Oil more affordable and vice versa.
The weekly Oil inventory reports published by the American Petroleum Institute (API) and the Energy Information Agency (EIA) impact the price of WTI Oil. Changes in inventories reflect fluctuating supply and demand. If the data shows a drop in inventories it can indicate increased demand, pushing up Oil price. Higher inventories can reflect increased supply, pushing down prices. API’s report is published every Tuesday and EIA’s the day after. Their results are usually similar, falling within 1% of each other 75% of the time. The EIA data is considered more reliable, since it is a government agency.
OPEC (Organization of the Petroleum Exporting Countries) is a group of 13 Oil-producing nations who collectively decide production quotas for member countries at twice-yearly meetings. Their decisions often impact WTI Oil prices. When OPEC decides to lower quotas, it can tighten supply, pushing up Oil prices. When OPEC increases production, it has the opposite effect. OPEC+ refers to an expanded group that includes ten extra non-OPEC members, the most notable of which is Russia.
Recommended Articles


