
GBP/USD Price Forecast: Hovers around 1.3550, support appears near nine-day EMA
- GBP/USD may find a primary barrier at 1.3616, the highest level since February 2022.
- A bullish bias prevails as the 14-day RSI remains above the 50 mark.
- The initial support appears at the nine-day EMA of 1.3526.
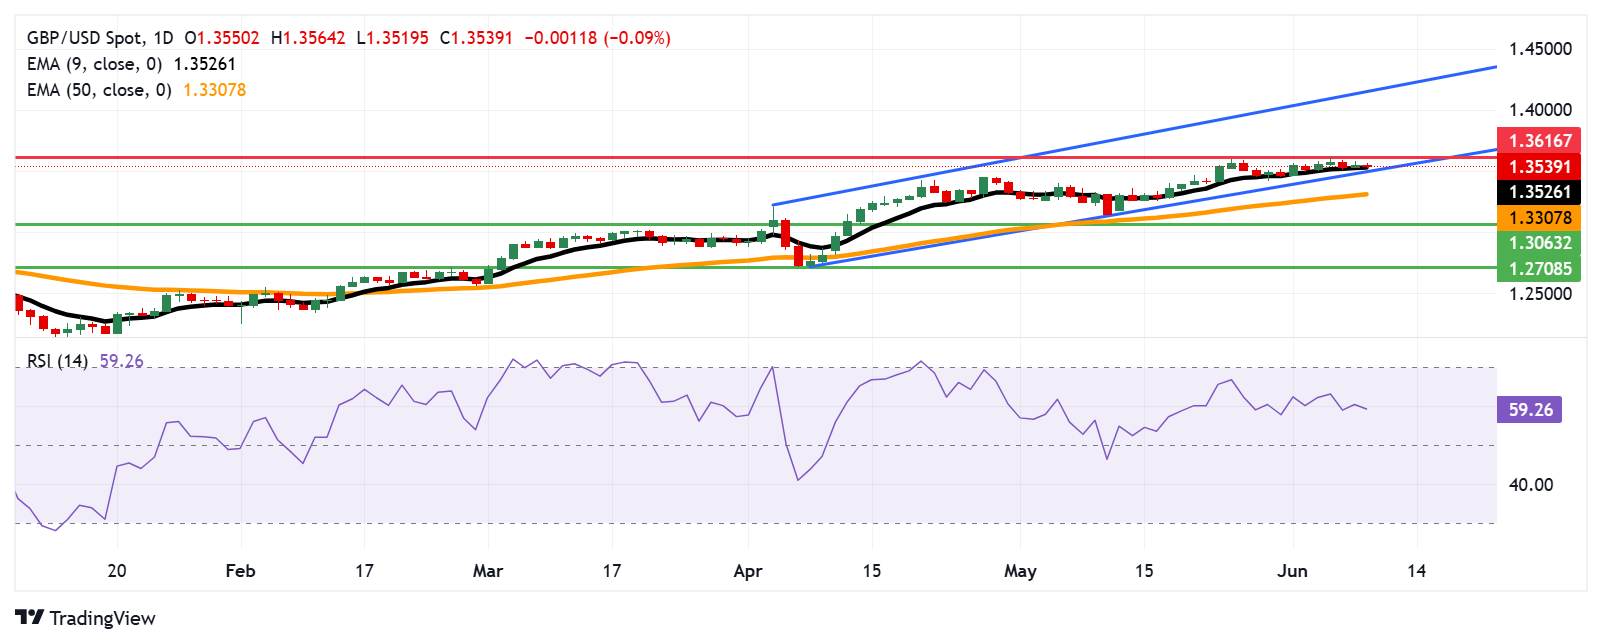
The GBP/USD pair retraces its recent gains, trading around 1.3540 during Asian hours on Tuesday. The technical analysis of the daily chart indicates a persistent bullish bias as the pair moves upwards within an ascending channel pattern.
The GBP/USD pair remains above the nine-day Exponential Moving Average (EMA), suggesting a stronger short-term price momentum. Additionally, the 14-day Relative Strength Index (RSI) is positioned above 50, reinforcing a bullish bias.
On the upside, the GBP/USD pair may test the resistance at 1.3616, reached on June 5, the highest level since February 2022. A break above this level could strengthen the bullish sentiment and support the pair to explore the region around the upper boundary of the ascending channel at 1.4160.
The GBP/USD pair may find the primary support at the nine-day EMA of 1.3526, followed by the ascending channel’s lower boundary at 1.3500. A successful break below this crucial support zone could cause the emergence of the bearish bias and put downward pressure on the pair to test the 50-day EMA at 1.3307, followed by the nine-week low at 1.3063, recorded on April 14.
GBP/USD: Daily Chart
British Pound PRICE Today
The table below shows the percentage change of British Pound (GBP) against listed major currencies today. British Pound was the weakest against the Australian Dollar.
| USD | EUR | GBP | JPY | CAD | AUD | NZD | CHF | |
|---|---|---|---|---|---|---|---|---|
| USD | 0.18% | 0.06% | 0.19% | 0.03% | -0.16% | -0.09% | 0.09% | |
| EUR | -0.18% | -0.11% | -0.02% | -0.11% | -0.31% | -0.26% | -0.06% | |
| GBP | -0.06% | 0.11% | 0.04% | -0.01% | -0.20% | -0.12% | 0.05% | |
| JPY | -0.19% | 0.02% | -0.04% | -0.13% | -0.38% | -0.36% | -0.18% | |
| CAD | -0.03% | 0.11% | 0.00% | 0.13% | -0.21% | -0.15% | 0.06% | |
| AUD | 0.16% | 0.31% | 0.20% | 0.38% | 0.21% | 0.07% | 0.25% | |
| NZD | 0.09% | 0.26% | 0.12% | 0.36% | 0.15% | -0.07% | 0.20% | |
| CHF | -0.09% | 0.06% | -0.05% | 0.18% | -0.06% | -0.25% | -0.20% |
The heat map shows percentage changes of major currencies against each other. The base currency is picked from the left column, while the quote currency is picked from the top row. For example, if you pick the British Pound from the left column and move along the horizontal line to the US Dollar, the percentage change displayed in the box will represent GBP (base)/USD (quote).
Recommended Articles


