
GBP/USD rises towards 1.3300 as UK economy grows above forecasts
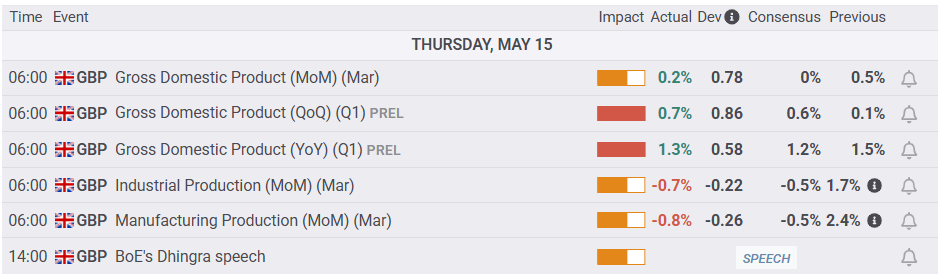
- UK GDP grows 0.7% in Q1 vs. 0.6% expected, easing BoE rate cut pressure and lifting Sterling.
- US April PPI falls -0.5% MoM, core -0.4%; Retail Sales barely rise, signaling slowing demand.
- Traders eye upcoming US housing data and UoM Sentiment survey; UK calendar remains light.
The Pound Sterling extended its gains against the US Dollar, driven by a positive reading of economic growth in the UK and softer-than-expected data in the US, which fueled speculation of a slower economic outlook. At the time of writing, the GBP/USD trades at 1.3293, up 0.31%.
GBP/USD climbs as UK economy posts stronger-than-expected growth while US inflation and retail data disappoint
US economic data released earlier suggested that the disinflationary process continues as the economy cools. The US Producer Price Index (PPI) in April declined 0.5% MoM, below the estimated 0.2% expansion. Excluding volatile items, PPI fell 0.4% MoM beneath forecasts of a 0.3% increase.
Other data showed that Retail Sales disappointed investors, edging up by 0.1% month-over-month (MoM), above forecasts for a 0.0% increase. Initial Jobless Claims for the week ending May 10 rose by 229,000, as expected, unchanged from the previous week.
Across the pond, Gross Domestic Product (GDP) figures suggested the economy is stronger than expected, exerting pressure on the Bank of England (BoE) to keep interest rates on hold. In the 3 months to March, GDP rose by 0.7%, up from 0.1% in the previous reading, bearing the 0.6% growth foreseen by economists and the BoE.
Source: FXStreet
Despite posting solid figures, US President Donald Trump’s trade policies and high UK employment taxes could weigh on the economic outlook. The British Finance Minister, Rachel Reeves, commented that economic headwinds are approaching and emphasized the significance of the government’s trade agreements with the US and India.
Ahead this week, the UK economic docket is absent. Across the Atlantic, housing data and the University of Michigan Consumer Sentiment preliminary survey for May would be eyed by traders.
GBP/USD Price Forecast: Technical outlook
From a technical standpoint, the GBP/USD remains upwardly biased; however, in the short term, a pullback may be on the cards. If the pair extended its losses below 1.33 and clears 1.3250, the first support would be the 1.3200 figure. Once breached, the next floor level would be the May 13 daily low of 1.3165.
Conversely, if GBP/USD climbs past 1.3359, the May 14 high, the next resistance would be the May 6 high at 1.3402.

British Pound PRICE This week
The table below shows the percentage change of British Pound (GBP) against listed major currencies this week. British Pound was the strongest against the New Zealand Dollar.
| USD | EUR | GBP | JPY | CAD | AUD | NZD | CHF | |
|---|---|---|---|---|---|---|---|---|
| USD | 0.63% | 0.13% | -0.41% | 0.62% | 0.17% | 0.88% | 0.24% | |
| EUR | -0.63% | -0.37% | -0.49% | 0.48% | 0.17% | 0.74% | 0.10% | |
| GBP | -0.13% | 0.37% | 0.06% | 0.85% | 0.56% | 1.04% | 0.47% | |
| JPY | 0.41% | 0.49% | -0.06% | 1.01% | -0.05% | 0.43% | 0.41% | |
| CAD | -0.62% | -0.48% | -0.85% | -1.01% | -0.17% | 0.26% | -0.39% | |
| AUD | -0.17% | -0.17% | -0.56% | 0.05% | 0.17% | 0.47% | -0.11% | |
| NZD | -0.88% | -0.74% | -1.04% | -0.43% | -0.26% | -0.47% | -0.67% | |
| CHF | -0.24% | -0.10% | -0.47% | -0.41% | 0.39% | 0.11% | 0.67% |
The heat map shows percentage changes of major currencies against each other. The base currency is picked from the left column, while the quote currency is picked from the top row. For example, if you pick the British Pound from the left column and move along the horizontal line to the US Dollar, the percentage change displayed in the box will represent GBP (base)/USD (quote).
Recommended Articles


