


Ethereum price extended its increase above the $2,720 zone. ETH is now correcting gains and might revisit the $2,500 support zone.
Ethereum started a fresh increase and cleared the $2,720 resistance.
The price is trading above $2,520 and the 100-hourly Simple Moving Average.
There is a short-term declining channel or a possible bullish flag forming with resistance at $2,630 on the hourly chart of ETH/USD (data feed via Kraken).
The pair could find bids near $2,500 and start a fresh increase in the near term.
Ethereum Price Dips Again
Ethereum price remained supported and started a fresh increase above $2,620, beating Bitcoin. ETH gained pace for a move above the $2,650 resistance zone.
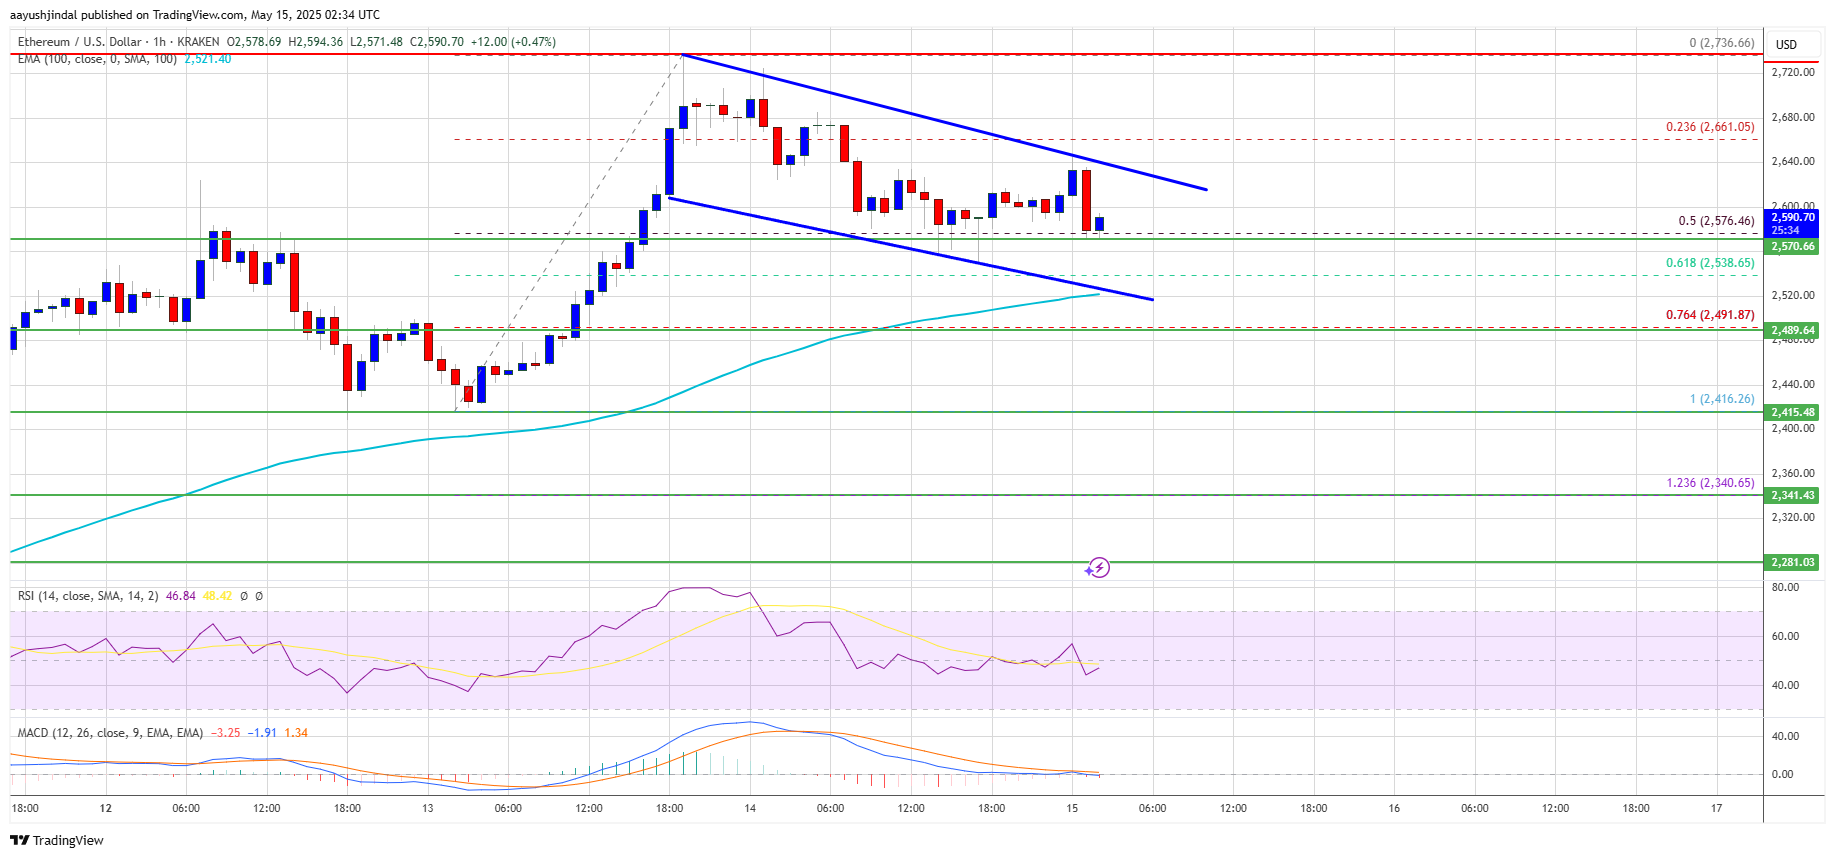
The bulls were able to push the price above the $2,700 resistance zone. A high was formed at $2,736 and the price is now correcting gains. The price dipped below $2,650 and even spiked below the 50% Fib retracement level of the upward move from the $2,415 swing low to the $2,736 high.
However, the bulls are still active above $2,550. Ethereum price is now trading above $2,550 and the 100-hourly Simple Moving Average. On the upside, the price seems to be facing hurdles near the $2,620 level. There is also a short-term declining channel or a possible bullish flag forming with resistance at $2,630 on the hourly chart of ETH/USD.
The next key resistance is near the $2,680 level. The first major resistance is near the $2,720 level. A clear move above the $2,720 resistance might send the price toward the $2,820 resistance. An upside break above the $2,820 resistance might call for more gains in the coming sessions. In the stated case, Ether could rise toward the $2,880 resistance zone or even $2,950 in the near term.
More Losses In ETH?
If Ethereum fails to clear the $2,630 resistance, it could start a fresh downside correction. Initial support on the downside is near the $2,575 level. The first major support sits near the $2,500 zone or the 76.4% Fib retracement level of the upward move from the $2,415 swing low to the $2,736 high.
A clear move below the $2,500 support might push the price toward the $2,420 support. Any more losses might send the price toward the $2,350 support level in the near term. The next key support sits at $2,320.
Technical Indicators
Hourly MACD – The MACD for ETH/USD is losing momentum in the bullish zone.
Hourly RSI – The RSI for ETH/USD is now below the 50 zone.
Major Support Level – $2,575
Major Resistance Level – $2,680
* The content presented above, whether from a third party or not, is considered as general advice only. This article should not be construed as containing investment advice, investment recommendations, an offer of or solicitation for any transactions in financial instruments.


