
US Dollar Index Price Forecast: Outlook remains bearish, key support level emerges near 98.00

US Dollar Index slumps to near 98.35 in Thursday’s early European session, losing 0.26% on the day.
The negative outlook of the index remains in play below the 100-day EMA.
The crucial support level to watch is the 98.10-98.00 region; the first upside barrier is seen at 99.38.
The US Dollar Index (DXY), an index of the value of the US Dollar (USD) measured against a basket of six world currencies, tumbles to the lowest level in seven weeks near 98.35 due to rising expectations of Federal Reserve (Fed) rate cuts this year and persistent uncertainty over tariff battles. Investors will focus on the US Producer Price Index (PPI) later on Thursday, followed by weekly Initial Jobless Claims.
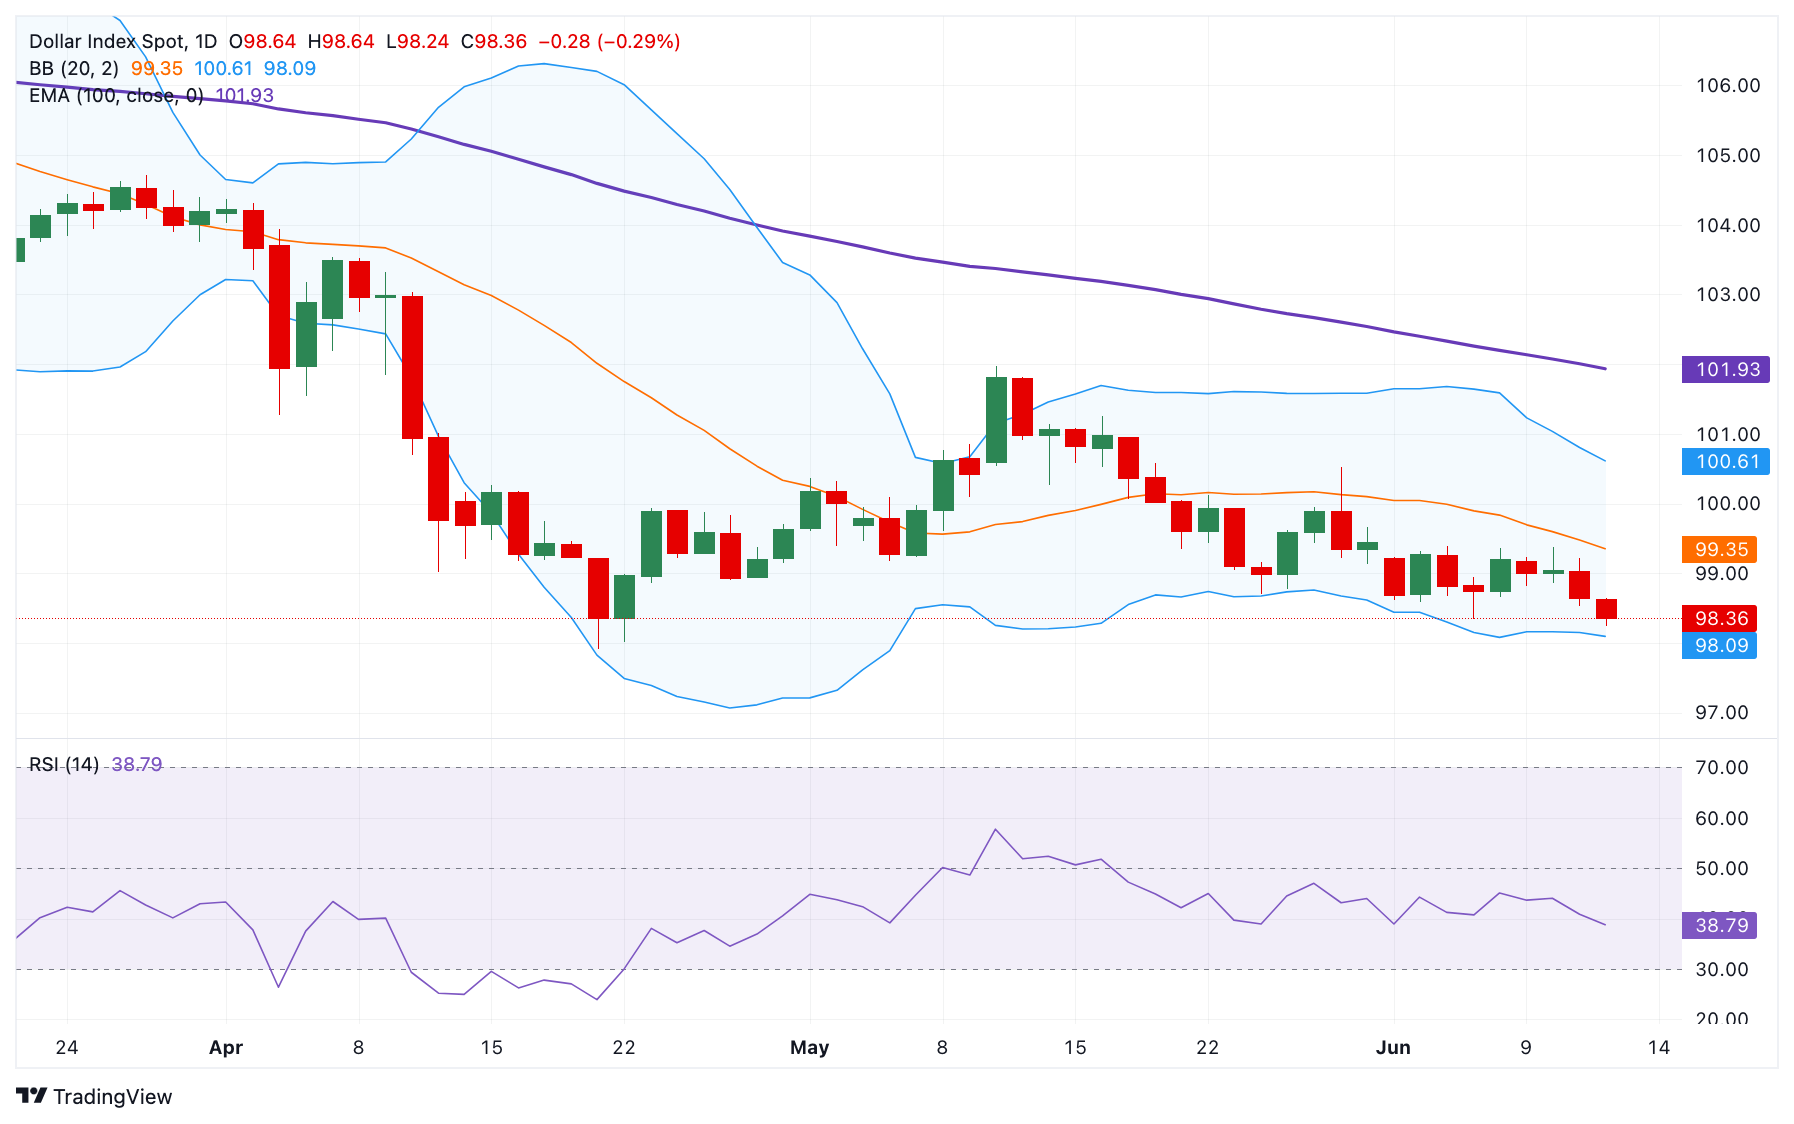
Technically, the bearish sentiment of the DXY remains intact as the index is below the key 100-day Exponential Moving Average (EMA) on the daily chart. The downward momentum is reinforced by the 14-day Relative Strength Index (RSI), which stands below the midline near 38.80, suggesting that further downside looks favorable in the near term.
The key support level for the US Dollar Index is located in the 98.10-98.00 zone, representing the lower limit of the Bollinger Band and the psychological level. A breach of this level could expose 97.70, the low of March 30, 2022. Further south, the next bearish target to watch is 96.55, the low of February 25, 2022.
On the bright side, the high of June 10 at 99.38 acts as an immediate resistance level for the DXY. The additional upside filter is seen at the 100.00 psychological mark. Extended gains could see a rally to 100.60, the upper boundary of the Bollinger Band.
US Dollar Index (DXY) daily chart
* The content presented above, whether from a third party or not, is considered as general advice only. This article should not be construed as containing investment advice, investment recommendations, an offer of or solicitation for any transactions in financial instruments.


