

GBP/JPY Price Forecast: Bearish outlook remains intact below 190.50
- GBP/JPY attracts some sellers to around 190.25 in Thursday’s early European session, down 0.35% on the day.
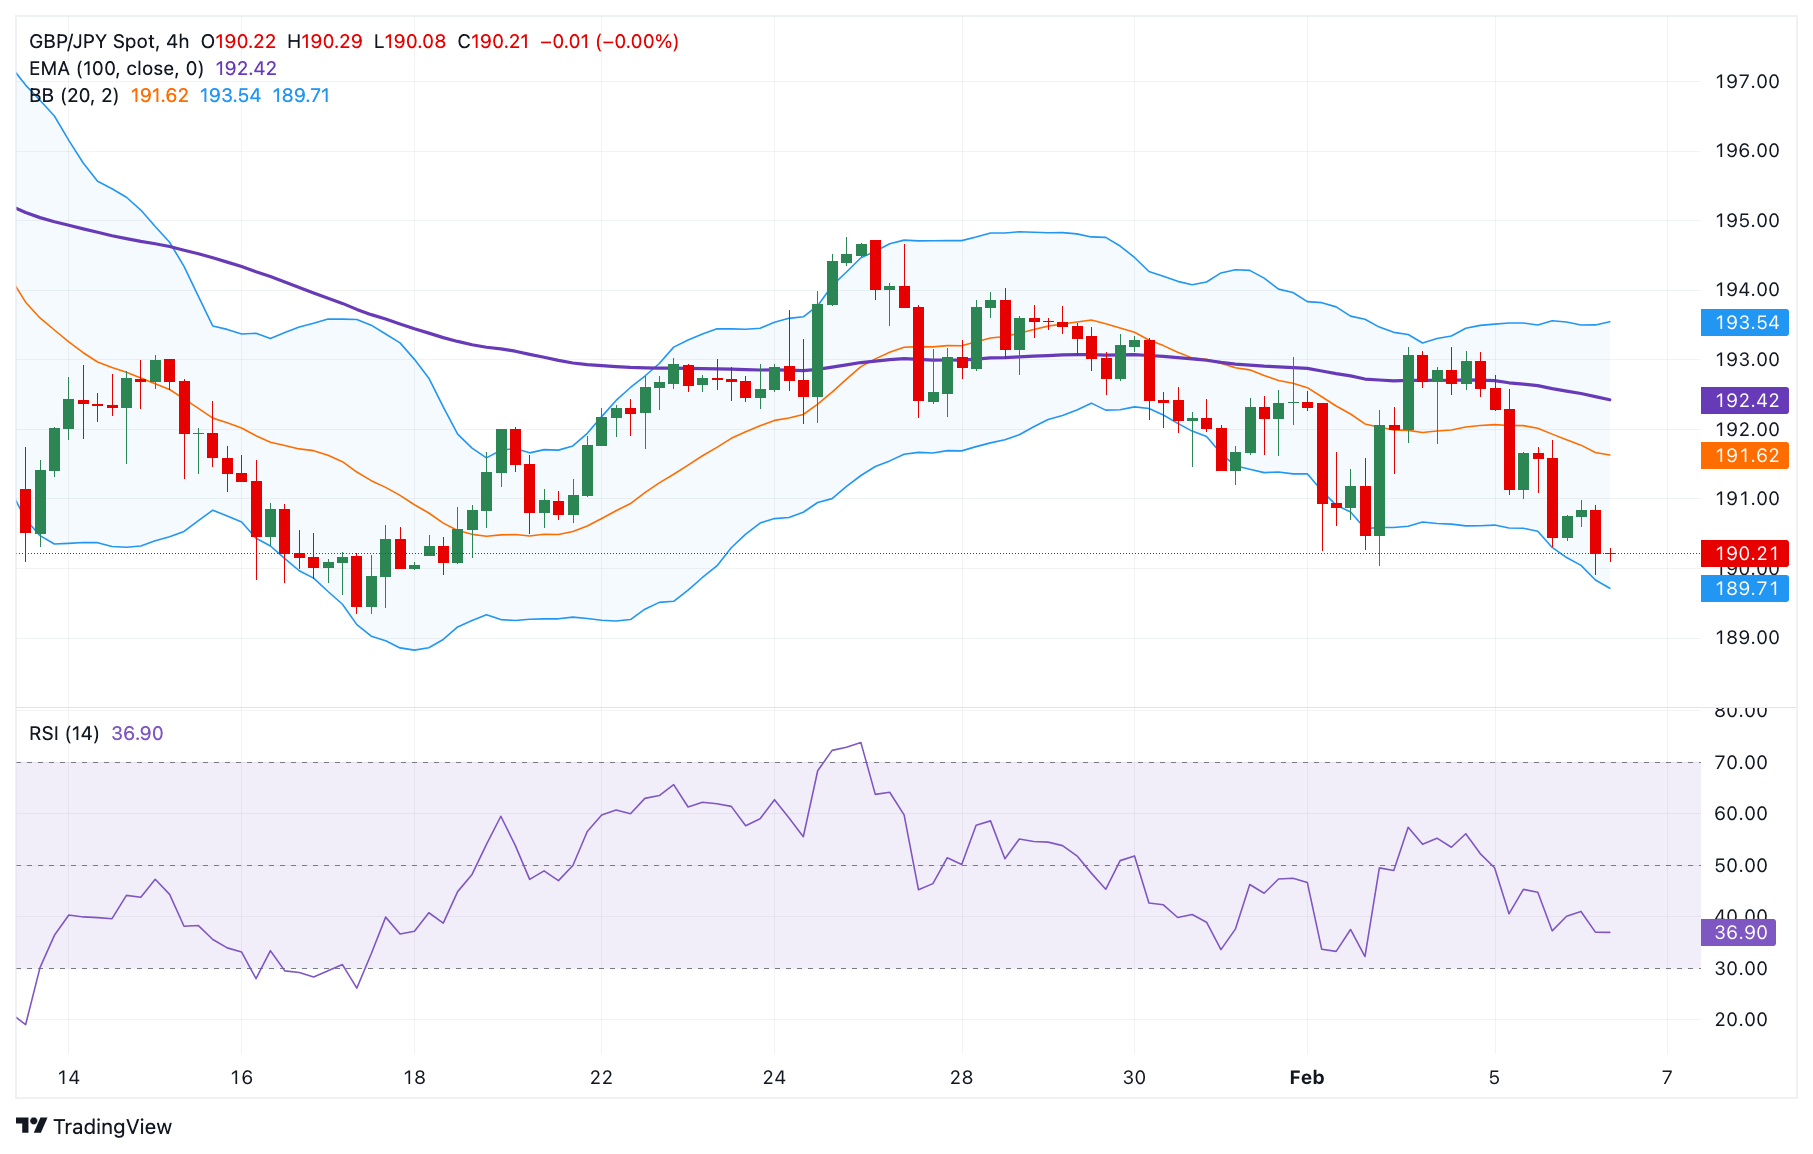
- The cross keeps the negative outlook below the 100-period EMA with a bearish RSI indicator.
- The initial support emerges at 190.00; first upside barrier is located at 192.40.
The GBP/JPY cross trades in a negative territory around 190.25 during the early European trading hours on Thursday. The growing speculation that the Bank of Japan (BoJ) would keep raising interest rates provides some support to the Japanese Yen (JPY) and creates a headwind for the cross.
Technically, the bearish outlook of GBP/JPY remains in play as the major pair remains capped below the key 100-period Exponential Moving Average (EMA) on the 4-hour chart. Furthermore, the downward momentum is supported by the Relative Strength Index (RSI), which is located below the midline around 37.00, suggesting that the path of least resistance is to the downside.
The first downside target for the cross emerges at the 190.00 psychological mark. Extended losses could see a drop to the lower limit of the Bollinger Band at 189.70. A decisive break below the mentioned level could pave the way to 189.34, the low of January 17.
On the bright side, the 100-period EMA at 192.40 acts as an immediate resistance level for the cross. Sustained trading above this level could attract some buyers to 193.54, the upper boundary of the Bollinger Band. Further north, the next hurdle is seen at 194.71, the high of January 27.
GBP/JPY 4-hour chart
Japanese Yen FAQs
The Japanese Yen (JPY) is one of the world’s most traded currencies. Its value is broadly determined by the performance of the Japanese economy, but more specifically by the Bank of Japan’s policy, the differential between Japanese and US bond yields, or risk sentiment among traders, among other factors.
One of the Bank of Japan’s mandates is currency control, so its moves are key for the Yen. The BoJ has directly intervened in currency markets sometimes, generally to lower the value of the Yen, although it refrains from doing it often due to political concerns of its main trading partners. The BoJ ultra-loose monetary policy between 2013 and 2024 caused the Yen to depreciate against its main currency peers due to an increasing policy divergence between the Bank of Japan and other main central banks. More recently, the gradually unwinding of this ultra-loose policy has given some support to the Yen.
Over the last decade, the BoJ’s stance of sticking to ultra-loose monetary policy has led to a widening policy divergence with other central banks, particularly with the US Federal Reserve. This supported a widening of the differential between the 10-year US and Japanese bonds, which favored the US Dollar against the Japanese Yen. The BoJ decision in 2024 to gradually abandon the ultra-loose policy, coupled with interest-rate cuts in other major central banks, is narrowing this differential.
The Japanese Yen is often seen as a safe-haven investment. This means that in times of market stress, investors are more likely to put their money in the Japanese currency due to its supposed reliability and stability. Turbulent times are likely to strengthen the Yen’s value against other currencies seen as more risky to invest in.
Recommended Articles


