

EUR/USD continues to grind out further losses
- EUR/USD has edged further lower, inching toward 1.0550.
- Euro continues to find little support in broader markets.
- EU GDP, US PPI inflation updates due Thursday.
EUR/USD continued to drift into the basement on Wednesday, clipping into a 54-week low and settling within touch range of 1.0550. Fiber continues to shed weight on the charts as broader FX markets pivot full-bore into holding the Greenback.
US Consumer Price Index (CPI) inflation figures came in stickier than many had hoped, but still well within median market forecasts, helping to keep investor sentiment elevated. Headline CPI held steady at 0.2% MoM as expected, while annualized headline CPI inflation accelerated to 2.6% YoY from the previous 2.4%, as markets predicted. Core CPI inflation also met market expectations, holding at 0.3% MoM and 3.3% on an annualized basis.
Euro traders will be looking ahead to pan-EU Gross Domestic Product (GDP) growth figures due early Thursday; final GDP growth is unlikely to buck the previous preliminary figures, and EUR bulls will have their fingers crossed that final GDP in the third quarter will stick to 0.4% QoQ, while the annualized figure is forecast to hold steady at a thoroughly unremarkable 0.9% YoY.
Also coming up on Thursday will be a fresh print of US Producer Price Index (PPI) business level inflation, which is forecast to accelerate in October to 3.0% from 2.8% YoY.
EUR/USD price forecast
The EUR/USD daily chart reveals a strong bearish trend, as the pair trades firmly below both the 50-day (blue line) and 200-day (black line) exponential moving averages (EMAs), currently at 1.0882 and 1.0884, respectively. This alignment, with the 50-day EMA below the 200-day EMA, signifies a bearish outlook in both the short and long term. The recent sell-off has pushed the pair closer to a significant psychological level at 1.0550, which could act as immediate support. If this level fails to hold, further declines may be on the horizon.
The MACD indicator on the chart underscores the prevailing bearish momentum. The MACD line is positioned below the signal line in negative territory, reflecting strong selling pressure. Furthermore, the expanding gap between the MACD and signal lines, along with a series of red histogram bars, indicates that bearish momentum is still intact. Without signs of a bullish divergence, the technical picture suggests limited buying interest, and any potential recovery could be met with resistance around the moving averages.
Looking ahead, a sustained break below the 1.0550 support level could open the door to a deeper retracement, possibly targeting the 1.0500 level in the coming sessions. On the flip side, for EUR/USD to reclaim a more bullish outlook, it would need to break back above the 200-day EMA, currently around 1.0884. Such a move would likely require a shift in market sentiment, potentially triggered by favorable economic data from the Eurozone or broad-based U.S. dollar weakness. Until such a recovery materializes, the technical setup remains bearish, with further downside expected if the support at 1.0550 gives way.
EUR/USD daily chart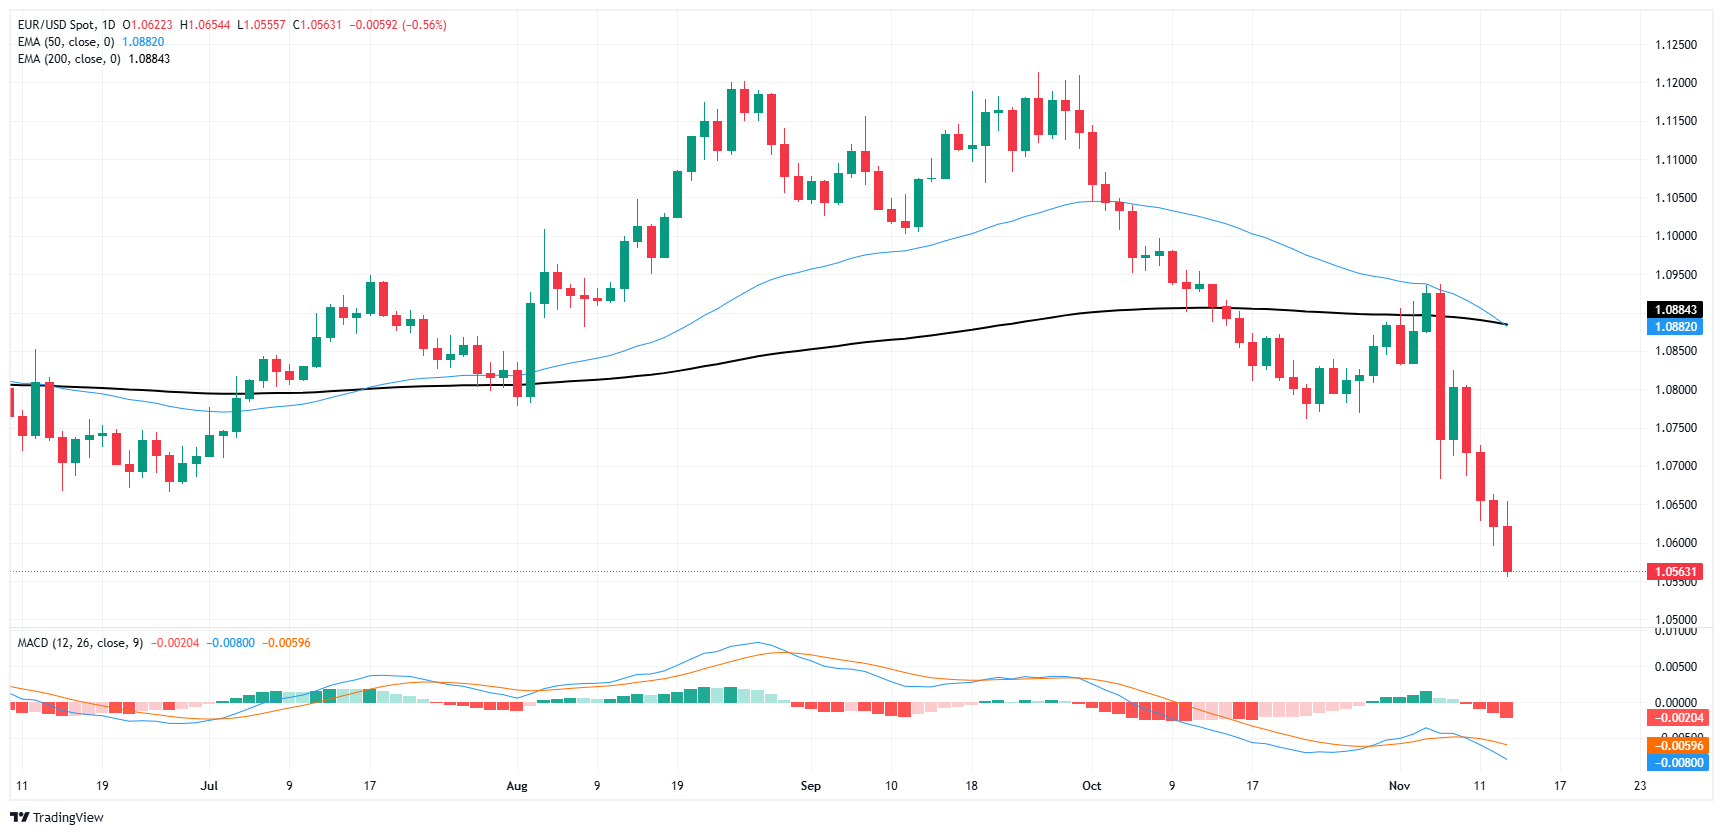
Euro FAQs
The Euro is the currency for the 19 European Union countries that belong to the Eurozone. It is the second most heavily traded currency in the world behind the US Dollar. In 2022, it accounted for 31% of all foreign exchange transactions, with an average daily turnover of over $2.2 trillion a day. EUR/USD is the most heavily traded currency pair in the world, accounting for an estimated 30% off all transactions, followed by EUR/JPY (4%), EUR/GBP (3%) and EUR/AUD (2%).
The European Central Bank (ECB) in Frankfurt, Germany, is the reserve bank for the Eurozone. The ECB sets interest rates and manages monetary policy. The ECB’s primary mandate is to maintain price stability, which means either controlling inflation or stimulating growth. Its primary tool is the raising or lowering of interest rates. Relatively high interest rates – or the expectation of higher rates – will usually benefit the Euro and vice versa. The ECB Governing Council makes monetary policy decisions at meetings held eight times a year. Decisions are made by heads of the Eurozone national banks and six permanent members, including the President of the ECB, Christine Lagarde.
Eurozone inflation data, measured by the Harmonized Index of Consumer Prices (HICP), is an important econometric for the Euro. If inflation rises more than expected, especially if above the ECB’s 2% target, it obliges the ECB to raise interest rates to bring it back under control. Relatively high interest rates compared to its counterparts will usually benefit the Euro, as it makes the region more attractive as a place for global investors to park their money.
Data releases gauge the health of the economy and can impact on the Euro. Indicators such as GDP, Manufacturing and Services PMIs, employment, and consumer sentiment surveys can all influence the direction of the single currency. A strong economy is good for the Euro. Not only does it attract more foreign investment but it may encourage the ECB to put up interest rates, which will directly strengthen the Euro. Otherwise, if economic data is weak, the Euro is likely to fall. Economic data for the four largest economies in the euro area (Germany, France, Italy and Spain) are especially significant, as they account for 75% of the Eurozone’s economy.
Another significant data release for the Euro is the Trade Balance. This indicator measures the difference between what a country earns from its exports and what it spends on imports over a given period. If a country produces highly sought after exports then its currency will gain in value purely from the extra demand created from foreign buyers seeking to purchase these goods. Therefore, a positive net Trade Balance strengthens a currency and vice versa for a negative balance.
Recommended Articles


