

Top 3 Price Prediction: Bitcoin, Ethereum, Ripple – BTC, ETH exceeds $121K and $3,000, XRP eyes above $3

- Bitcoin Drops to $70,000. U.S. Government Refuses to Bail Out Market, End of Bull Market or Golden Pit?
- Gold rallies further beyond $5,050 amid flight to safety, dovish Fed expectations
- Bitcoin Bottom Debate: $70,000 or $50,000?
- A Crash After a Surge: Why Silver Lost 40% in a Week?
- Bitcoin Slips Below 75,000 Mark. Will Strategy Change Its Mind and Sell?
- Bitcoin Rout. Bridgewater Founder Dalio Publicly Backs Gold.

Bitcoin records a new all-time high, surpassing $121K, with bulls targeting $126K.
Ethereum edges higher above $3,000, supported by a golden cross, increasing the chances of further gains.
Ripple’s XRP extends Sunday's gains for a bullish start to the week, inching closer to the $3 mark.
Bitcoin (BTC) extends the gains from Sunday, printing a record high of $121,492 at press time on Monday. Ethereum (ETH) exceeds the $3,000 mark while Ripple (XRP) advances on a bullish route, inching closer to the $3 mark. With the rising bullish momentum, traders anticipate an extended rally among the top 3 cryptocurrencies.
Bitcoin hits a new all-time high, targets $126K
Bitcoin edges higher by nearly 2% at press time on Monday, entering the uncharted levels above $121K. The BTC rally challenges the 61.8% trend-based Fibonacci retracement level at $121,357 drawn from the April 7 low of $74,508 to the high of May 22 at $111,980.
With Bitcoin entering the price discovery mode, a daily close above $121,357 could extend the uptrend to the 78.6% Fibonacci level at $127,652.
The Relative Strength Index (RSI) reads 77 on the daily chart, highlighting Bitcoin as overbought. Further, the Moving Average Convergence/Divergence (MACD) indicator displays rising green histogram bars from the zero line, suggesting increased bullish momentum.
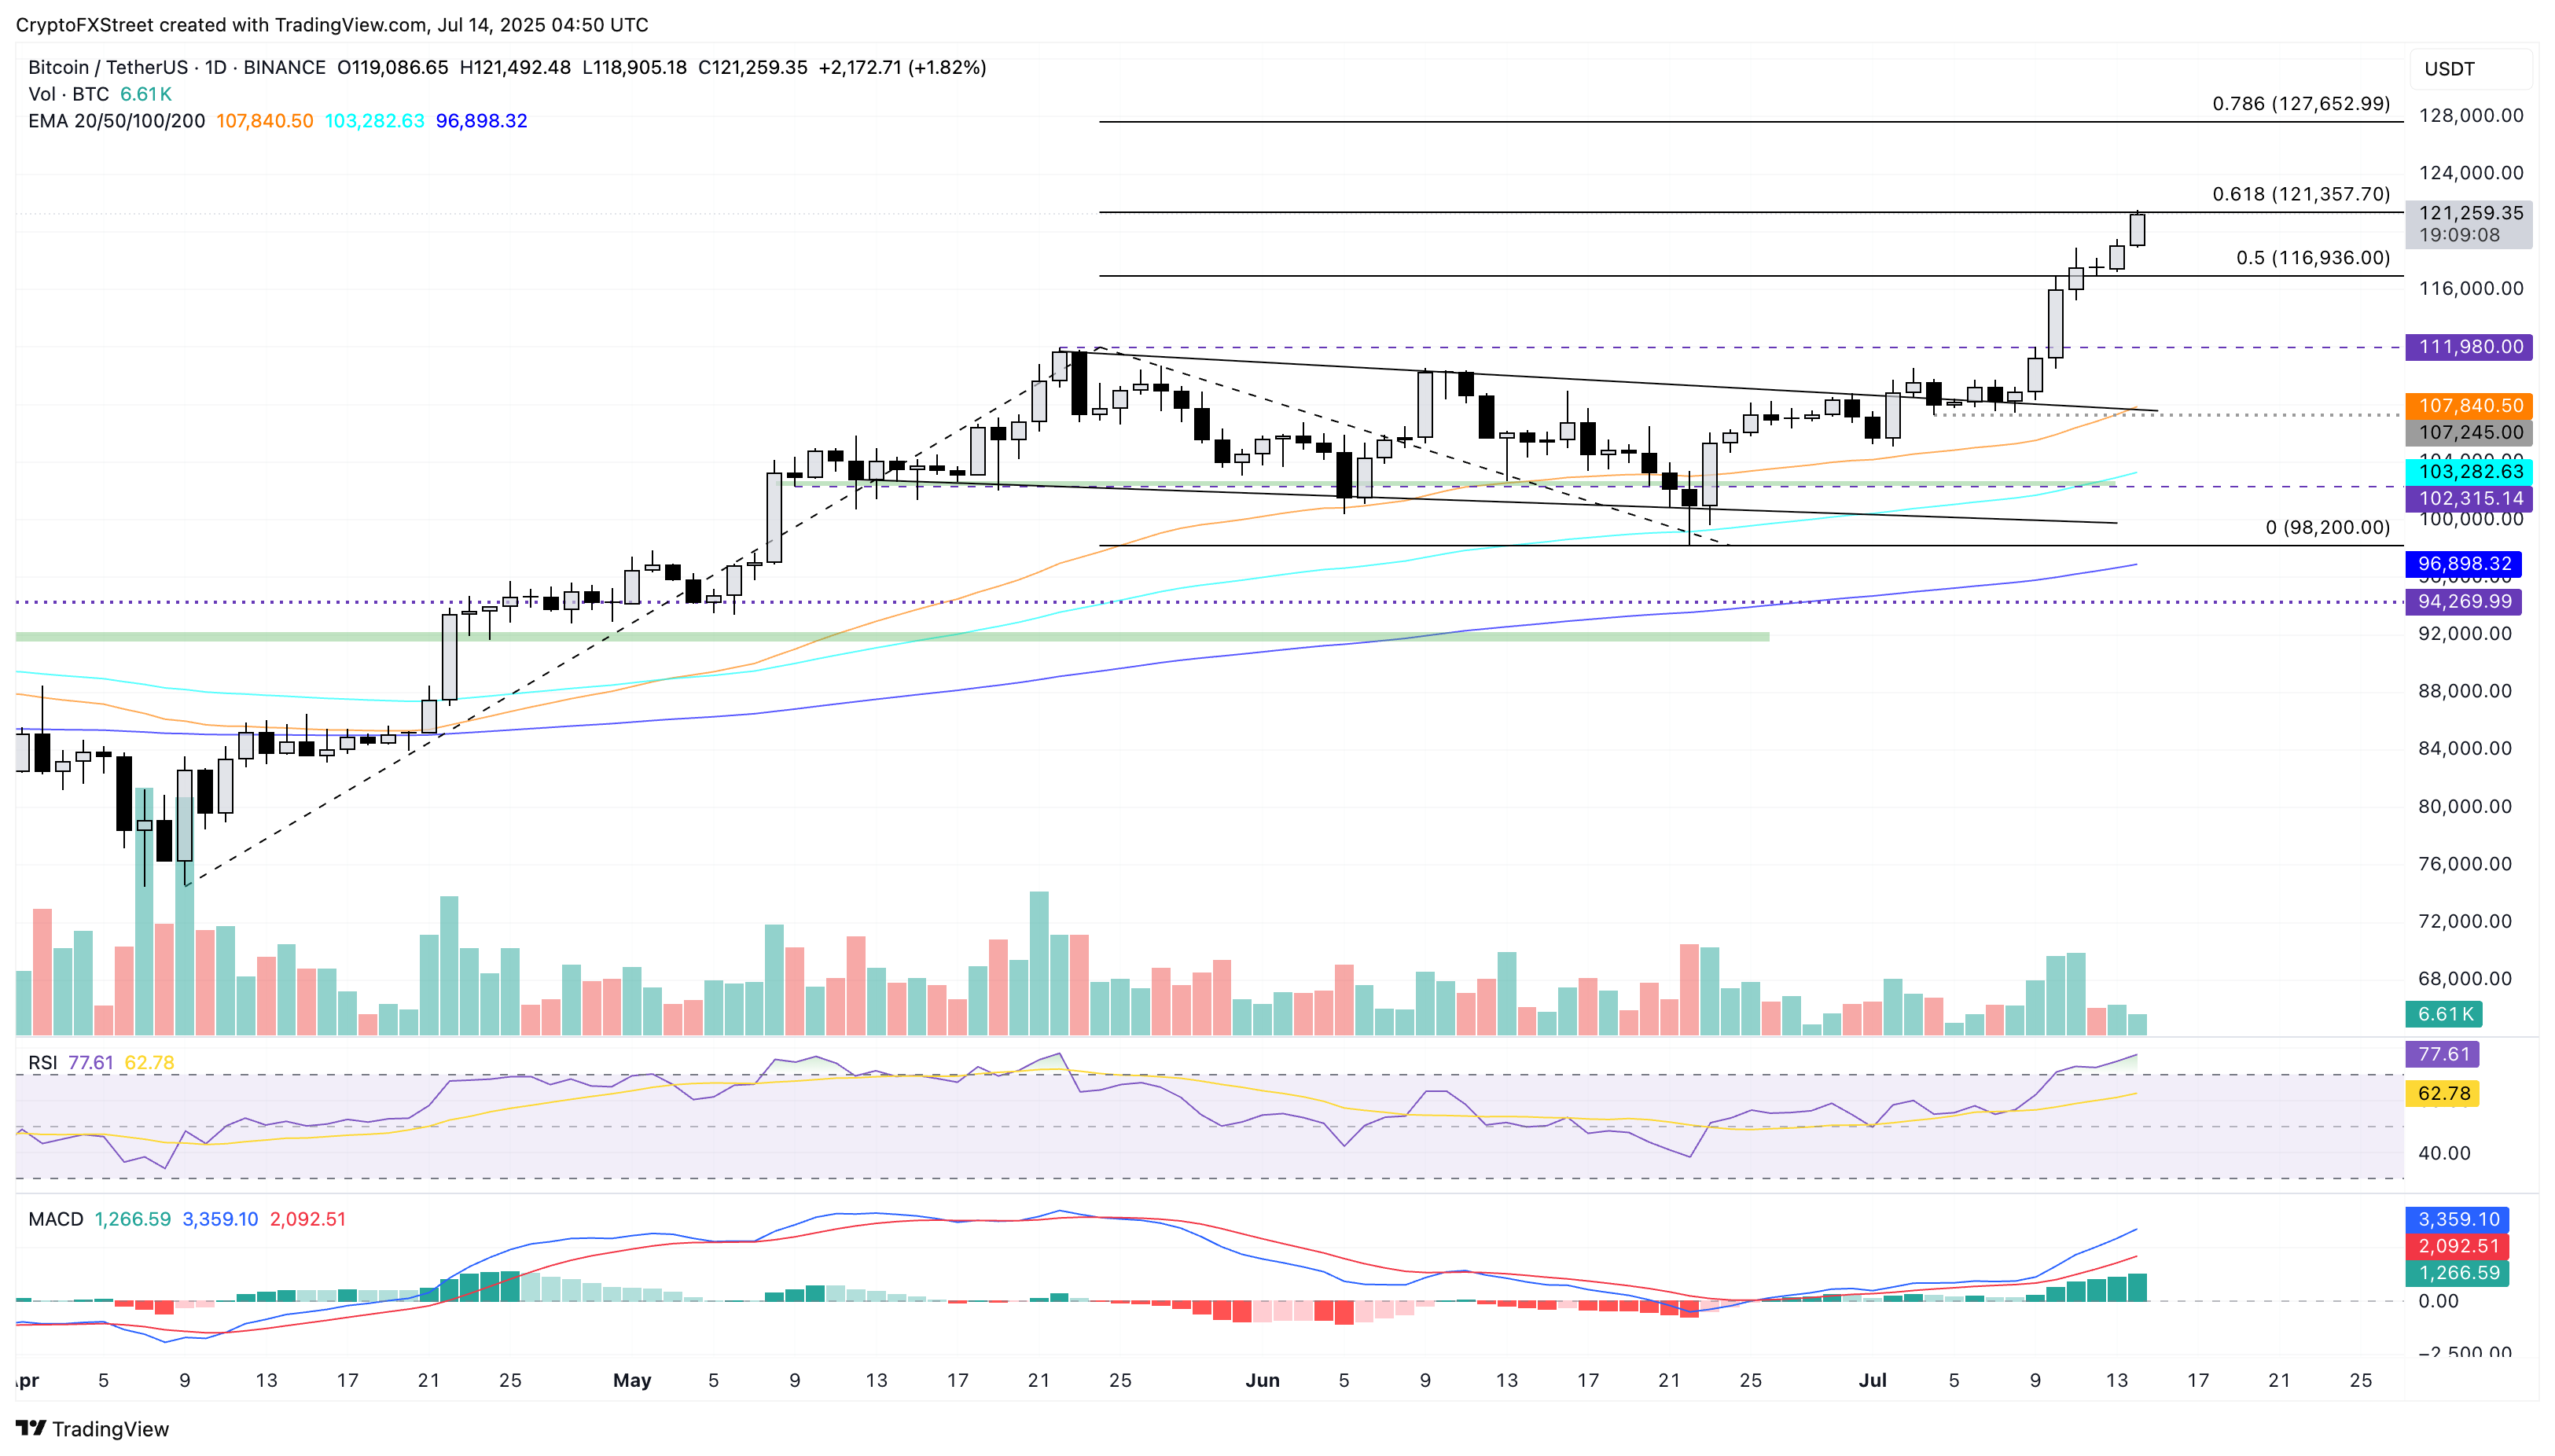
BTC/USDT daily price chart.
If BTC reverses from the 61.8% Fibonacci level at $121,357, it could extend the declining trend to the 50% level at $116,936.
Ethereum exceeds $3,000 as uptrend gains traction
Ethereum appreciates over 2% on the day at the time of writing, exceeding the $3,000 milestone for a new five-month high. The biggest altcoin inches closer to the 61.8% Fibonacci retracement level at $3,067 drawn from the December 16 high of $4,107 to the April 9 low of $1,385.
A decisive close above this level could extend the uptrend towards the 78.6% Fibonacci level at 3,525.
The 50-day Exponential Moving Average (EMA) crossing above the 200-day EMA marks a golden crossover, generally considered to be a buy signal.
The technical indicators indicate a surge in bullish momentum as the RSI at 74 highlights overbought conditions alongside the green histogram bars rising on the MACD indicator.
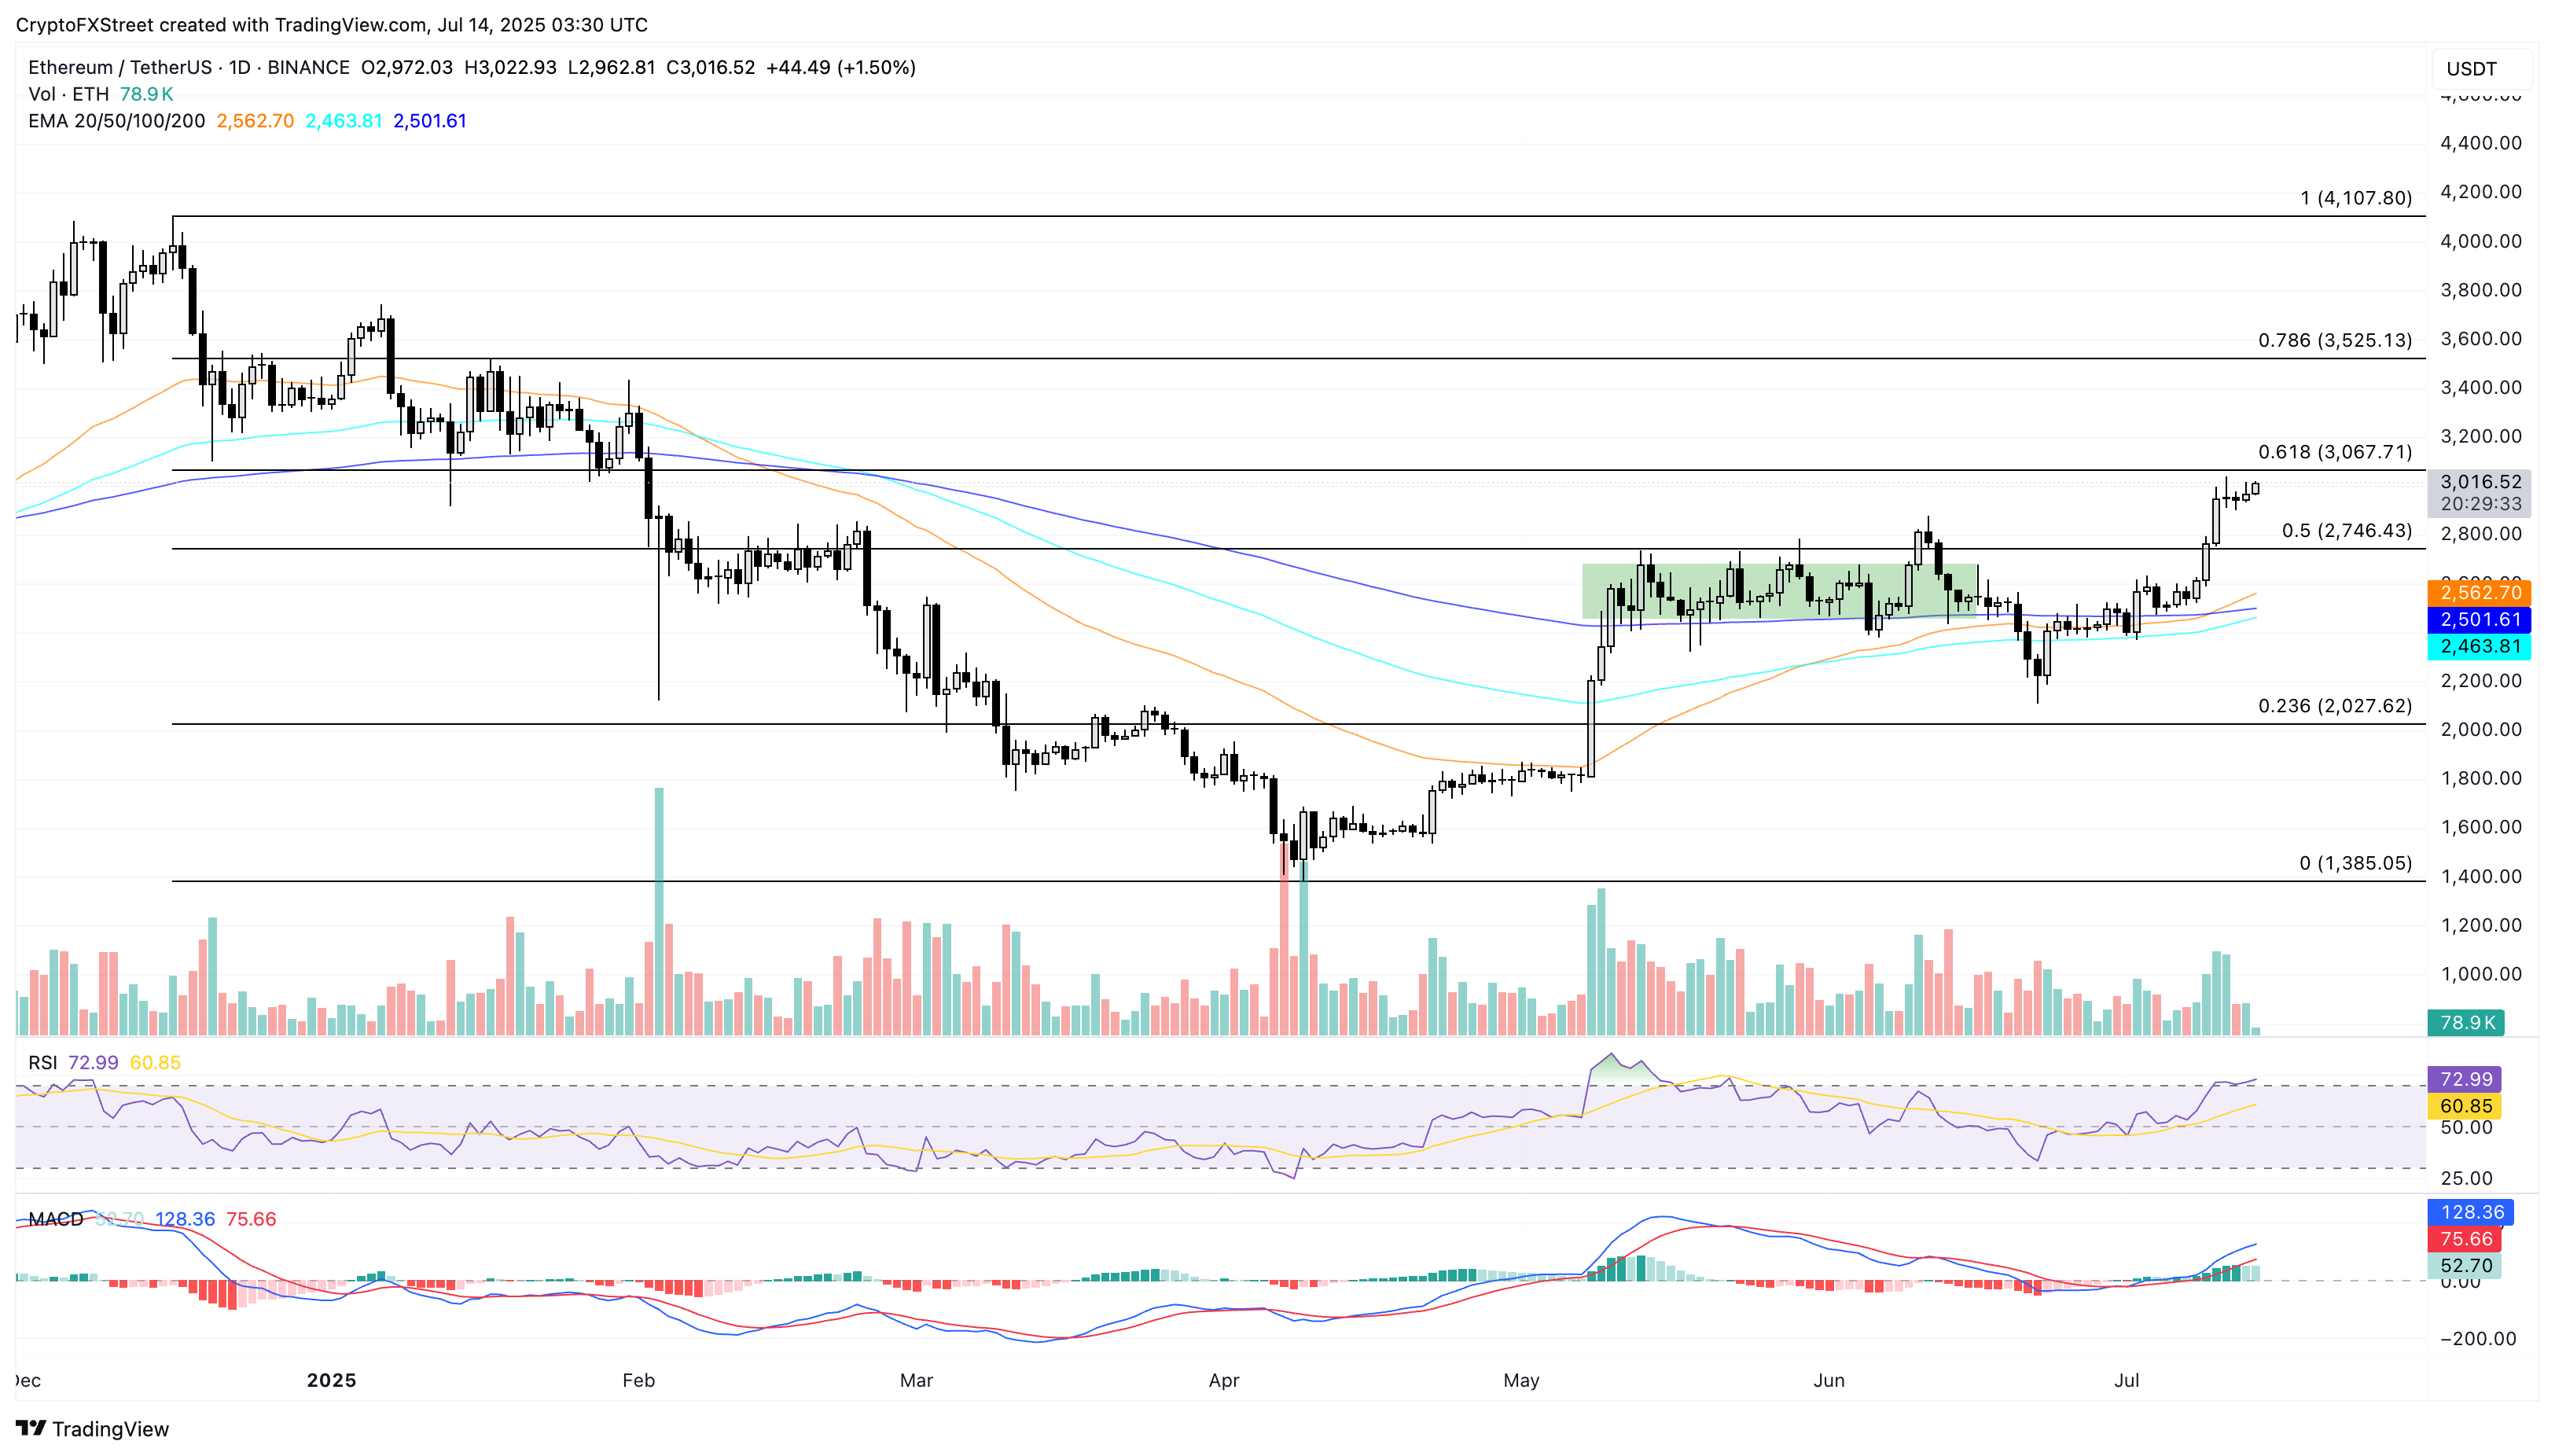
ETH/USDT daily price chart.
On the contrary, if Ethereum reverses from the $3,067, it could result in a retest of the 50% Fibonacci level at $2,746.
XRP’s trend reversal rally eyes $3 breakout
Ripple’s XRP trades higher by over 3% on Monday so far, building on the 24% rise from last week. The cross-border payment token marks the breakout of a resistance trendline formed by the highs of January 16 and May 12.
As XRP rises towards the $2.99 resistance level marked by the high of March 2, a daily close above it could extend the uptrend towards the $3.29 level, last tested on January 20.
According to the RSI at 83, XRP is extremely overbought at current levels after the parabolic rise. Still, the MACD indicator suggests a surge in bullish momentum as the green histogram bars surge from the zero line.
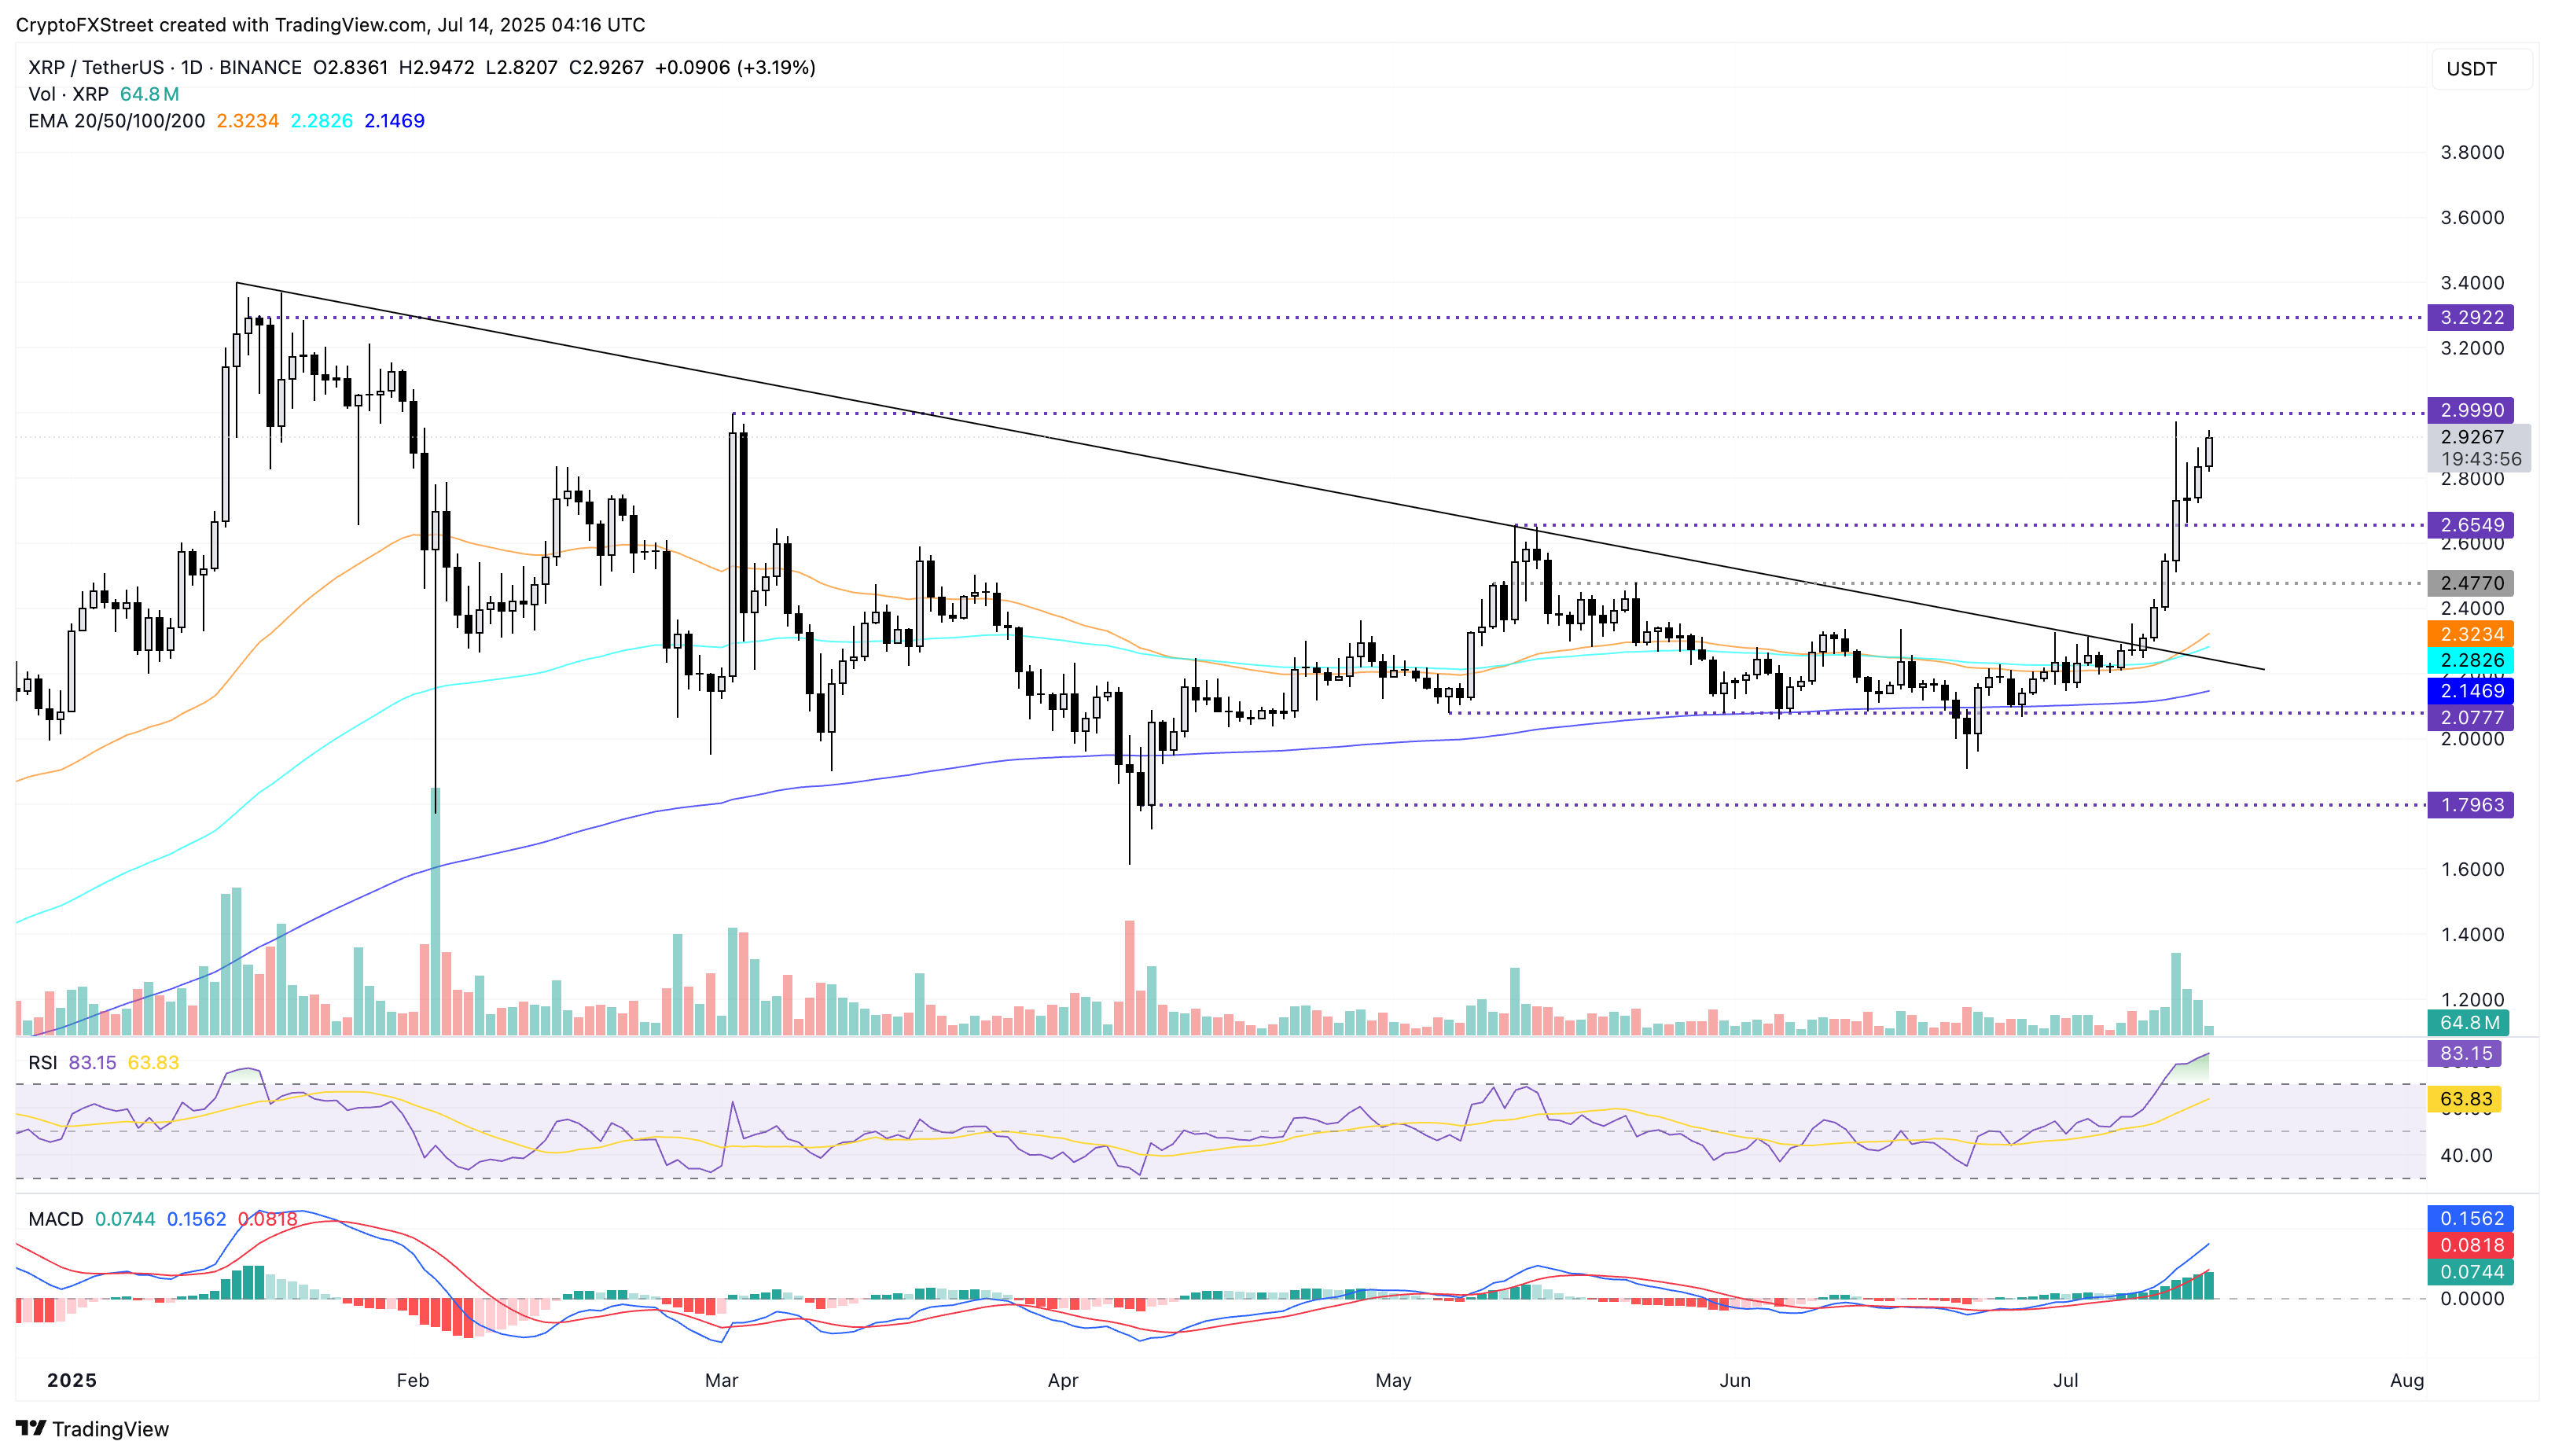
XRP/USDT daily price chart.
On the downside, a reversal in XRP could retest the $2.65 support level last tested on Saturday.
Read more
* The content presented above, whether from a third party or not, is considered as general advice only. This article should not be construed as containing investment advice, investment recommendations, an offer of or solicitation for any transactions in financial instruments.


