


GBP/USD tests 1.33 as Greenback weakness prevails
- GBP/USD continues to test fresh 30-month highs.
- Fed rate cut sparks broadbase Greenback selloff.
- BoE held rates despite early summer cut, UK Retail Sales in the pipe.
GBP/USD found a fresh 30-month high bid on Thursday, with a broad-market selloff in the US Dollar sparking a risk bid in Cable and bolstering the Pound Sterling. The Federal Reserve’s (Fed) 50 bps cut this week helped galvanized global markets into a risk-on stance, while the Bank of England’s (BoE) fearful rate hold did little to spark further strength under the GBP.
The only datapoint of note on Friday will be UK Retail Sales for August, though not much momentum is likely to come of it with investors exhausted after a double-header of central banks between the Fed and the BoE. UK MoM Retail Sales in August are expected to tick down to 0.4% from the previous 0.5%, while the annualized figure is expected to hold steady at 1.4%.
The BoE held interest rates steady at 5.0% early Thursday, with the Monetary Policy Committee (MPC) voting seven-to-one for another rate hold. The BoE initially opened the gates to rate cuts earlier in the summer with a quarter-point cut at the last meeting, but the move may have proved to be premature. BoE policymakers are waiting to see how the UK economy unfolds before making further rate adjustments.
On the US data side, Initial Jobless Claims eased back to 219K for the week ended September 13, down from the previous week’s revised 231K and under the median market forecast of 230K. The Philadelphia Fed Manufacturing Survey for September also printed well above expectations, with the spread index of manufacturing conditions improving to 1.7 from the previous seven-month low of -7.0 and handily beating the expected print of -1.0.
Fed Chair Jerome Powell convinced markets that the Fed’s outsized jumbo cut of 50 bps this week wasn’t a snap response to deteriorating economic conditions but rather an attempt to get ahead of the curve and bolster the US labor market. Powell successfully floated a rebranding of an entire half-percentage-point cut as a “recalibration,” and investors rewarded the Fed’s latest narrative pivot by plowing cash into risk assets across the board and yanking the rug out from beneath the safe-haven US Dollar.
Economic Indicator
Retail Sales (MoM)
The Retail Sales data, released by the Office for National Statistics on a monthly basis, measures the volume of sales of goods by retailers in Great Britain directly to end customers. Changes in Retail Sales are widely followed as an indicator of consumer spending. Percent changes reflect the rate of changes in such sales, with the MoM reading comparing sales volumes in the reference month with the previous month. Generally, a high reading is seen as bullish for the Pound Sterling (GBP), while a low reading is seen as bearish.
Read more.Next release: Fri Sep 20, 2024 06:00
Frequency: Monthly
Consensus: 0.4%
Previous: 0.5%
Source: Office for National Statistics
GBP/USD price forecast
Despite clipping into a fresh 30-month high on Thursday and crossing the 1.3300 handle, Cable bidders have struggled to push price action deep into bull country, and markets will enter the Friday wrapup with prices hovering near the key psychological level. A firm bullish trend is still baked into daily candlesticks with the pair climbing above the 50–day Exponential Moving Average (EMA) near 1.3000.
GBP/USD daily chart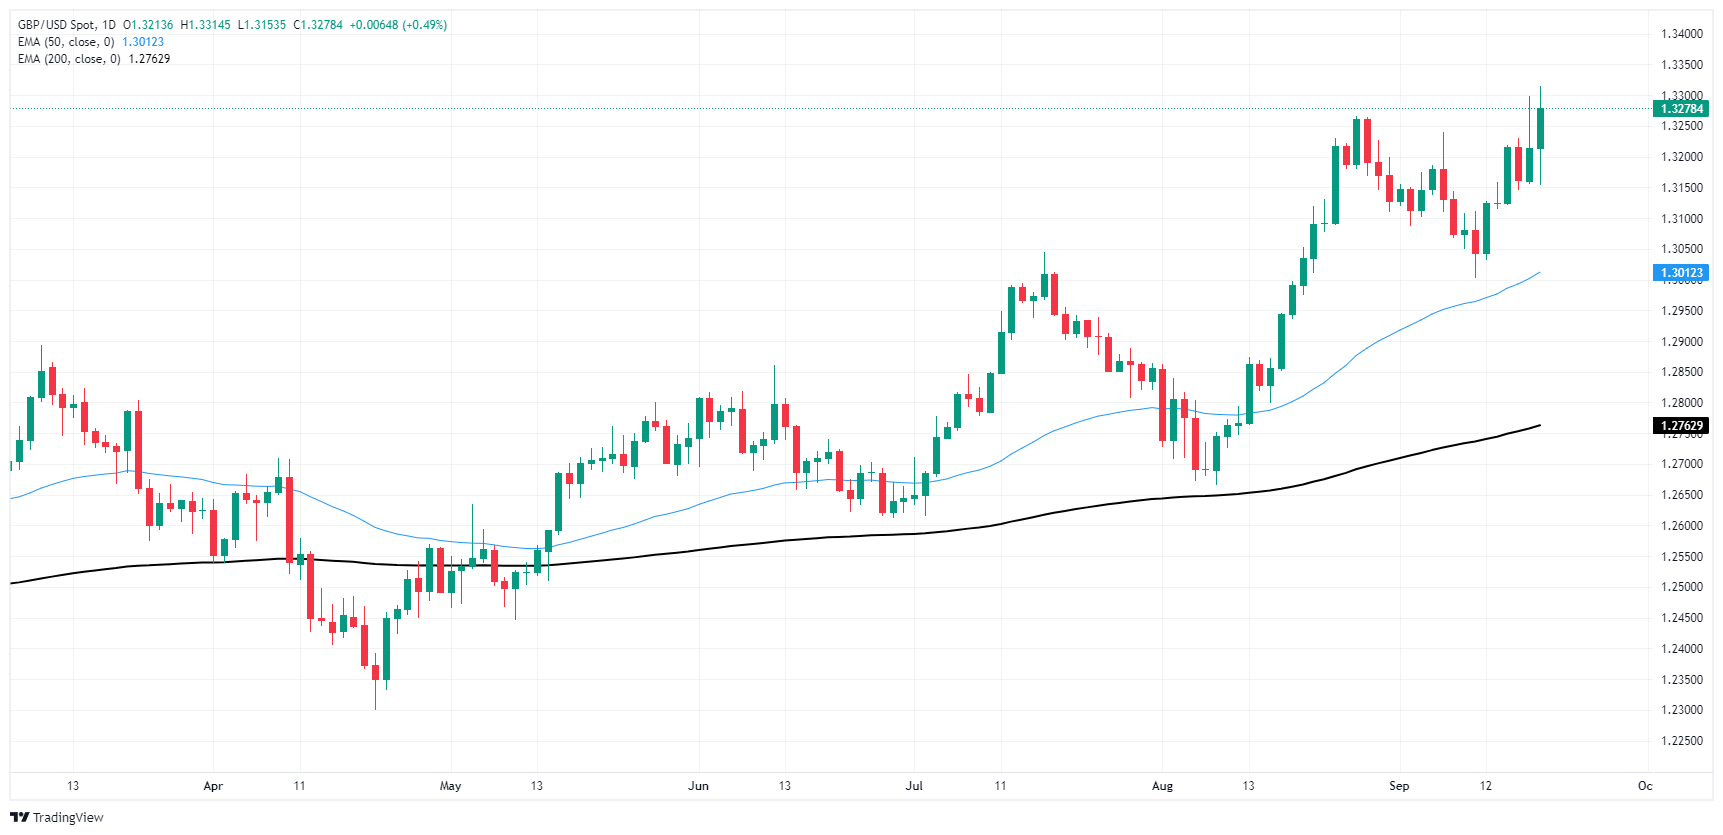
Pound Sterling FAQs
The Pound Sterling (GBP) is the oldest currency in the world (886 AD) and the official currency of the United Kingdom. It is the fourth most traded unit for foreign exchange (FX) in the world, accounting for 12% of all transactions, averaging $630 billion a day, according to 2022 data. Its key trading pairs are GBP/USD, aka ‘Cable’, which accounts for 11% of FX, GBP/JPY, or the ‘Dragon’ as it is known by traders (3%), and EUR/GBP (2%). The Pound Sterling is issued by the Bank of England (BoE).
The single most important factor influencing the value of the Pound Sterling is monetary policy decided by the Bank of England. The BoE bases its decisions on whether it has achieved its primary goal of “price stability” – a steady inflation rate of around 2%. Its primary tool for achieving this is the adjustment of interest rates. When inflation is too high, the BoE will try to rein it in by raising interest rates, making it more expensive for people and businesses to access credit. This is generally positive for GBP, as higher interest rates make the UK a more attractive place for global investors to park their money. When inflation falls too low it is a sign economic growth is slowing. In this scenario, the BoE will consider lowering interest rates to cheapen credit so businesses will borrow more to invest in growth-generating projects.
Data releases gauge the health of the economy and can impact the value of the Pound Sterling. Indicators such as GDP, Manufacturing and Services PMIs, and employment can all influence the direction of the GBP. A strong economy is good for Sterling. Not only does it attract more foreign investment but it may encourage the BoE to put up interest rates, which will directly strengthen GBP. Otherwise, if economic data is weak, the Pound Sterling is likely to fall.
Another significant data release for the Pound Sterling is the Trade Balance. This indicator measures the difference between what a country earns from its exports and what it spends on imports over a given period. If a country produces highly sought-after exports, its currency will benefit purely from the extra demand created from foreign buyers seeking to purchase these goods. Therefore, a positive net Trade Balance strengthens a currency and vice versa for a negative balance.
Recommended Articles


