

EUR/USD gets dragged down by Greenback recovery as ECB stands pat once more
- EUR/USD backlides to 1.0900 handle on Thursday as US Dollar flows recover lost ground.
- The ECB held rates steady on Thursday as policymakers keep watching for inflation.
- Fiber traders to turn toward next week’s pan-EU inflation figures.
EUR/USD shed weight on Thursday, falling back into the 1.0900 key handle amid a broad-market recovery in Greenback bidding. An uptick in weekly US jobless claims helped to further support hopes for a September rate cut from the Federal Reserve (Fed), while the European Central Bank (ECB) balked in the face of lopsided economic data and opted to keep rates on hold for the time being.
Forex Today: Investors’ attention now looks at Fedspeak
With an ECB rate hold on the books for July, Fiber traders will be turning to next week’s pan-EU Harmonized Index of Consumer Prices (HICP) inflation data. Friday is a largely low-tier data showing for the Euro, leaving investors to sit and wait for next Tuesday’s inflation data to begin sussing out odds of a follow-up rate cut to the ECB’s initial rate trim in June.
US Initial Jobless Claims increased more than expected on Thursday, adding 243K new unemployment benefits seekers for the week ended July 12 compared to the expected 230K, and rising above the previous week’s revised 223K. With labor data softening, market expectations of a September rate cut will be further bolstered, but bets for a Fed rate trim have nowhere left to go with markets already pricing in nearly 100% odds of a quarter-point rate cut from the Federal Open Market Committee (FOMC) on September 18.
Euro PRICE This week
The table below shows the percentage change of Euro (EUR) against listed major currencies this week. Euro was the strongest against the New Zealand Dollar.
| USD | EUR | GBP | JPY | CAD | AUD | NZD | CHF | |
|---|---|---|---|---|---|---|---|---|
| USD | 0.07% | 0.32% | -0.57% | 0.44% | 1.17% | 1.04% | -0.76% | |
| EUR | -0.07% | 0.28% | -0.43% | 0.57% | 1.14% | 1.18% | -0.64% | |
| GBP | -0.32% | -0.28% | -0.63% | 0.27% | 0.85% | 0.84% | -0.92% | |
| JPY | 0.57% | 0.43% | 0.63% | 1.01% | 1.53% | 1.60% | -0.38% | |
| CAD | -0.44% | -0.57% | -0.27% | -1.01% | 0.66% | 0.62% | -1.20% | |
| AUD | -1.17% | -1.14% | -0.85% | -1.53% | -0.66% | 0.04% | -1.76% | |
| NZD | -1.04% | -1.18% | -0.84% | -1.60% | -0.62% | -0.04% | -1.81% | |
| CHF | 0.76% | 0.64% | 0.92% | 0.38% | 1.20% | 1.76% | 1.81% |
The heat map shows percentage changes of major currencies against each other. The base currency is picked from the left column, while the quote currency is picked from the top row. For example, if you pick the Euro from the left column and move along the horizontal line to the US Dollar, the percentage change displayed in the box will represent EUR (base)/USD (quote).
EUR/USD technical outlook
The Fiber saw its worst trading day in over a month on Thursday, flubbing recent bullish momentum and tumbling back into the 1.0900 handle after reaching a four-month high just shy of 1.0950. Intraday price action is still holding north of the 200-hour Exponential Moving Average (EMA) at 1.0879, but an extended slide could kick off another round of bearishness.
EUR/USD has cycled the 200-day EMA at 1.0800 since last November, and another technical rejection from 1.0900 leaves the Fiber exposed to a bearish reversal. A shortside push could see the pair tumbling back to June’s recent lows below 1.0700.
EUR/USD hourly chart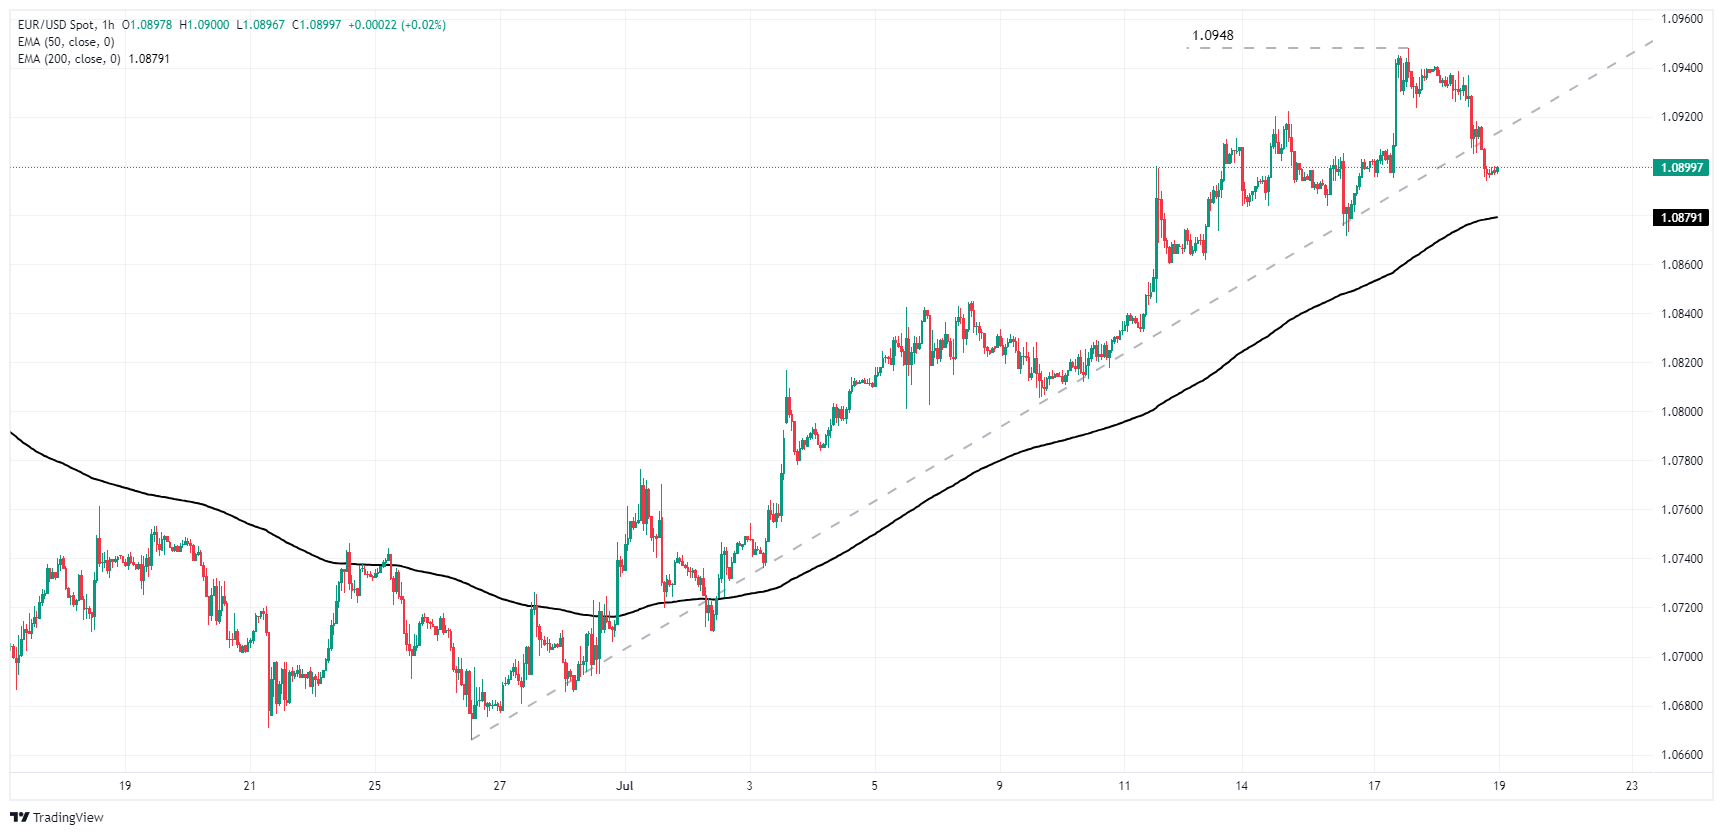
EUR/USD daily chart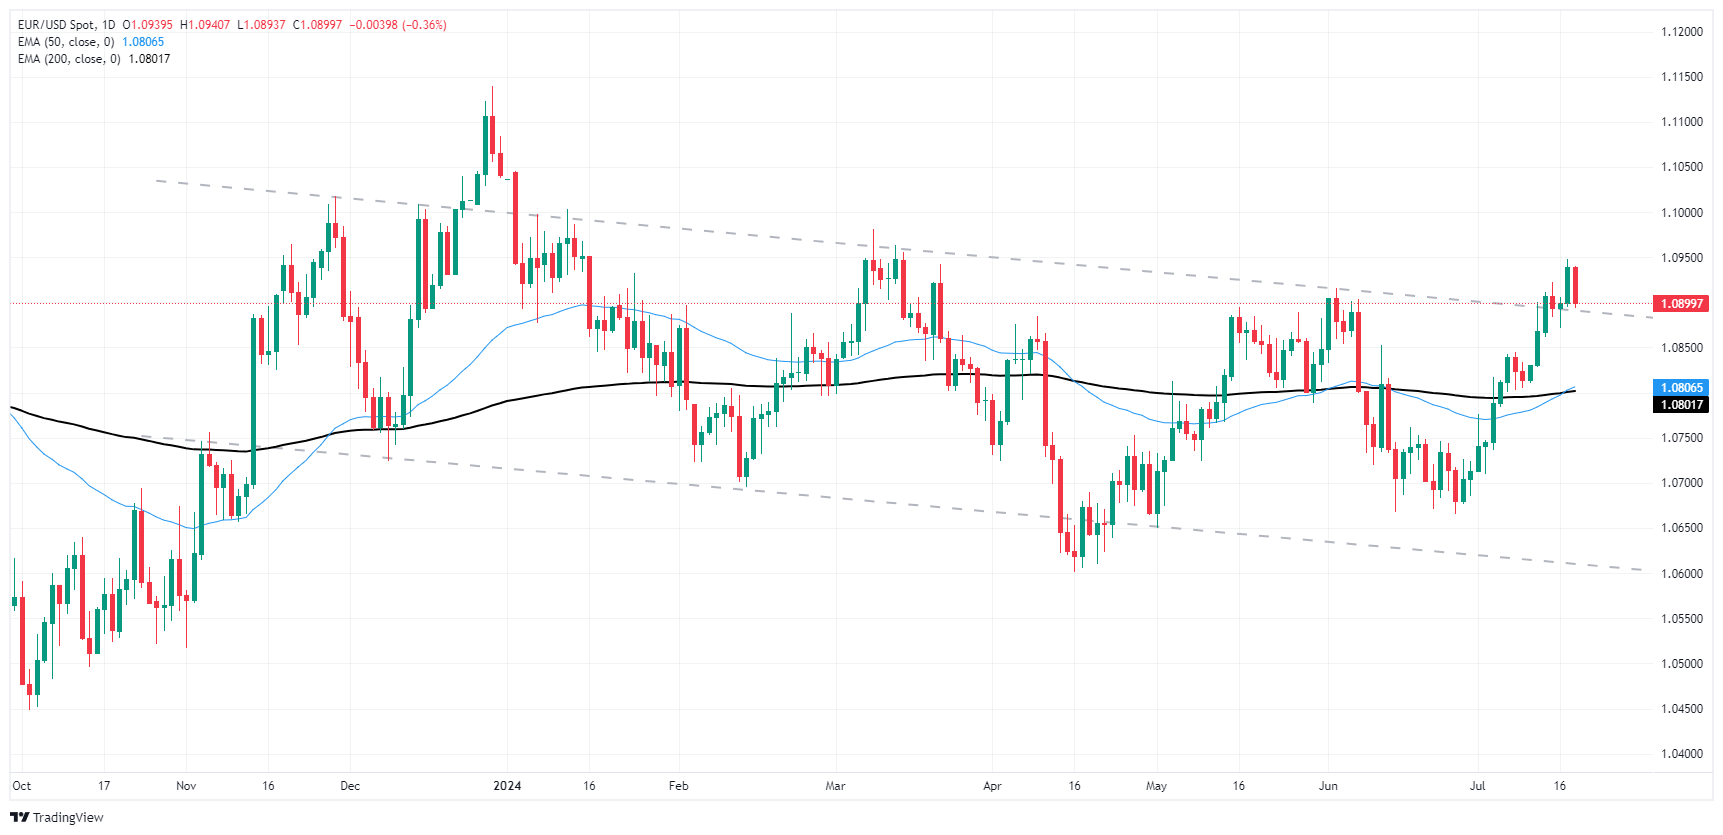
Euro FAQs
The Euro is the currency for the 20 European Union countries that belong to the Eurozone. It is the second most heavily traded currency in the world behind the US Dollar. In 2022, it accounted for 31% of all foreign exchange transactions, with an average daily turnover of over $2.2 trillion a day. EUR/USD is the most heavily traded currency pair in the world, accounting for an estimated 30% off all transactions, followed by EUR/JPY (4%), EUR/GBP (3%) and EUR/AUD (2%).
The European Central Bank (ECB) in Frankfurt, Germany, is the reserve bank for the Eurozone. The ECB sets interest rates and manages monetary policy. The ECB’s primary mandate is to maintain price stability, which means either controlling inflation or stimulating growth. Its primary tool is the raising or lowering of interest rates. Relatively high interest rates – or the expectation of higher rates – will usually benefit the Euro and vice versa. The ECB Governing Council makes monetary policy decisions at meetings held eight times a year. Decisions are made by heads of the Eurozone national banks and six permanent members, including the President of the ECB, Christine Lagarde.
Eurozone inflation data, measured by the Harmonized Index of Consumer Prices (HICP), is an important econometric for the Euro. If inflation rises more than expected, especially if above the ECB’s 2% target, it obliges the ECB to raise interest rates to bring it back under control. Relatively high interest rates compared to its counterparts will usually benefit the Euro, as it makes the region more attractive as a place for global investors to park their money.
Data releases gauge the health of the economy and can impact on the Euro. Indicators such as GDP, Manufacturing and Services PMIs, employment, and consumer sentiment surveys can all influence the direction of the single currency. A strong economy is good for the Euro. Not only does it attract more foreign investment but it may encourage the ECB to put up interest rates, which will directly strengthen the Euro. Otherwise, if economic data is weak, the Euro is likely to fall. Economic data for the four largest economies in the euro area (Germany, France, Italy and Spain) are especially significant, as they account for 75% of the Eurozone’s economy.
Another significant data release for the Euro is the Trade Balance. This indicator measures the difference between what a country earns from its exports and what it spends on imports over a given period. If a country produces highly sought after exports then its currency will gain in value purely from the extra demand created from foreign buyers seeking to purchase these goods. Therefore, a positive net Trade Balance strengthens a currency and vice versa for a negative balance.
Recommended Articles


