EUR/CAD Price Forecast: Bullish continuation pattern forming

Source Fxstreet
  • EUR/CAD is tipped to go higher if a bullish continuation pattern completes. 
  • The price pattern is enhanced by the ADX indicator rising strongly above 20.
  • EUR/CAD could reach 1.5000 and beyond if it continues bullish momentum. 

EUR/CAD is rising strongly as diverging interest-rate expectations favor the Euro (EUR) over the Canadian Dollar (CAD). 

The pair is trading at about 1.4950 at the time of writing and is forming a continuation price pattern (shaded blue rectangle) which – should it complete – could forecast probable higher prices to come. 

EUR/CAD Daily Chart


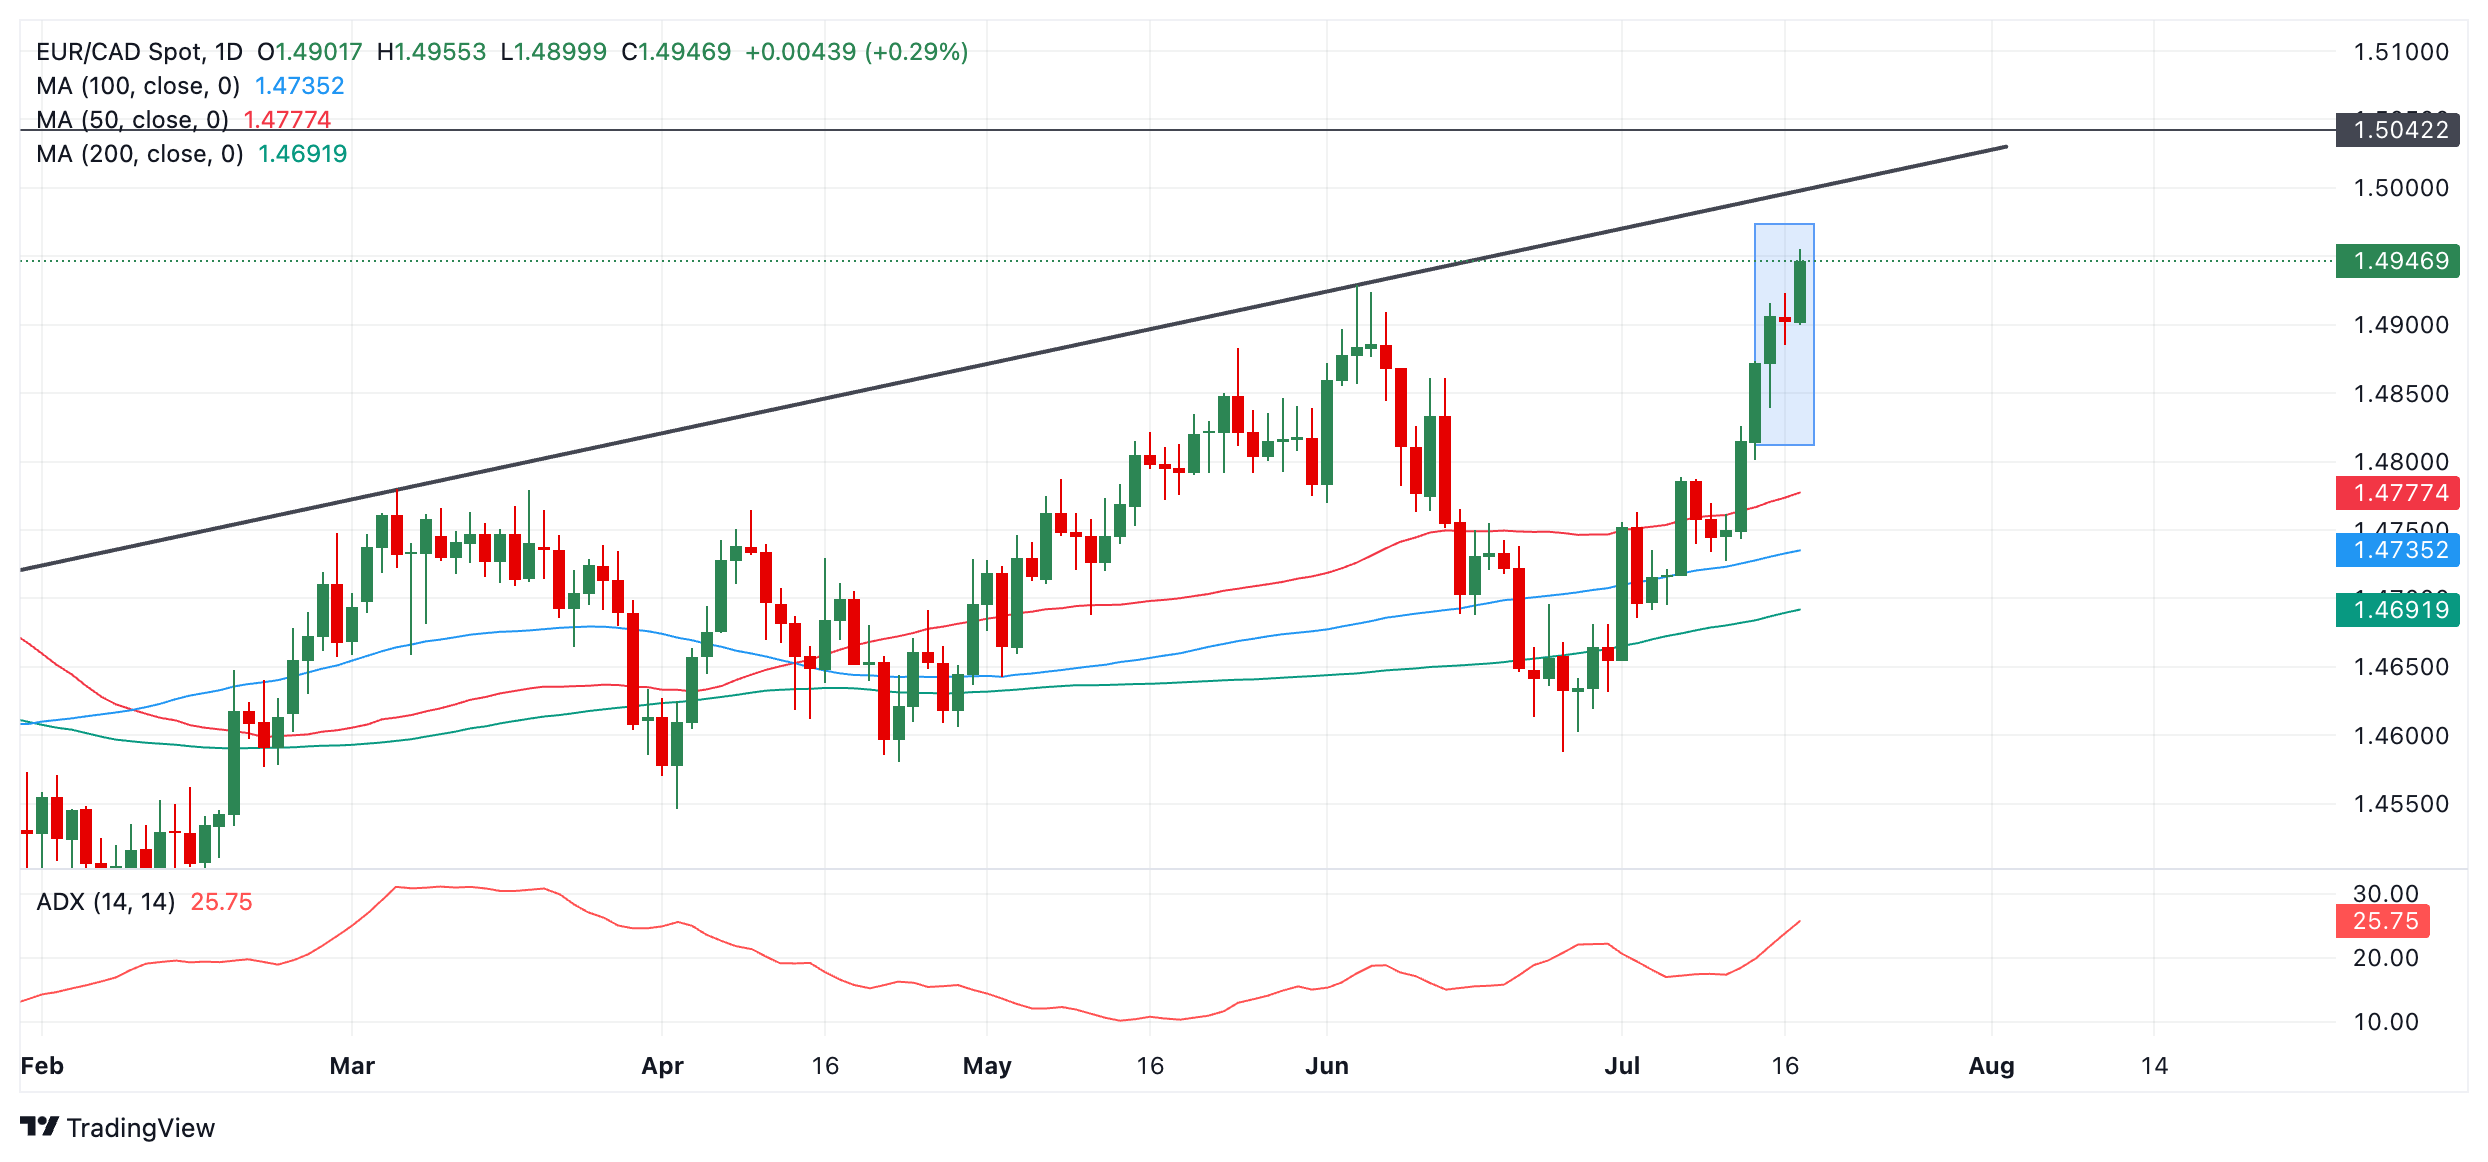
Assuming that Wednesday’s close is above 1.4930 and the day ends as a bullish green candle, the pattern will be confirmed. 

The Average Directional Indicator (ADX) is used to assess the strength of the trend and it is rising at above 20 further confirming the likelihood of the bull trend continuing.

If the pattern completes – as looks highly likely – the pair will probably rise to roughly 1.5000, where it will encounter resistance from the dark gray trendline. A break above the day’s highs would serve as confirmation. 

It is also possible it could continue even higher to the resistance line at 1.5040. 

A decline below 1.4839, however, would invalidate the pattern. 


Disclaimer: For information purposes only. Past performance is not indicative of future results.
placeholder
Bitcoin Suffers Year’s Strongest Waterfall-Style Decline. Will It Next Drop to the $60,000 Mark?During the Asian trading session on June 4, Bitcoin continued its multi-day slump, briefly dropping below the $62,000 mark to $61,338. As of press time, Bitcoin was trading at $63,844, wi
Author  TradingKey
7 hours ago
During the Asian trading session on June 4, Bitcoin continued its multi-day slump, briefly dropping below the $62,000 mark to $61,338. As of press time, Bitcoin was trading at $63,844, wi
placeholder
Bitcoin drops below $65K amid reinforced bear market signalsBitcoin (BTC) dipped further below $65,000 on Wednesday, with onchain data from Glassnode signaling a market firmly in a bear phase. The decline has pushed prices back into a key valuation range between the Realized Price and the True Market Mean.
Author  FXStreet
16 hours ago
Bitcoin (BTC) dipped further below $65,000 on Wednesday, with onchain data from Glassnode signaling a market firmly in a bear phase. The decline has pushed prices back into a key valuation range between the Realized Price and the True Market Mean.
placeholder
Forex Today: US Dollar stays resilient ahead of key US dataHere is what you need to know on Wednesday, June 3:
Author  FXStreet
Yesterday 10: 27
Here is what you need to know on Wednesday, June 3:
placeholder
$1.5 Billion in Crypto Assets Liquidated, Bitcoin Falls Below $66,000 Mark. What Is the Reason?On June 2, Eastern Time, the cryptocurrency market suffered its most severe wave of concentrated liquidations so far this year. Bitcoin ( BTC) fell below the $70,000 psychological support
Author  TradingKey
Yesterday 06: 32
On June 2, Eastern Time, the cryptocurrency market suffered its most severe wave of concentrated liquidations so far this year. Bitcoin ( BTC) fell below the $70,000 psychological support
placeholder
WTI rises to near $93.00 as Iran launches missiles toward Kuwait, BahrainWest Texas Intermediate (WTI) gains ground for the third successive day, trading around $92.90 per barrel during the Asian hours on Wednesday.
Author  FXStreet
Yesterday 01: 24
West Texas Intermediate (WTI) gains ground for the third successive day, trading around $92.90 per barrel during the Asian hours on Wednesday.
Related Instrument
goTop
quote