

GBP/JPY Price Forecast: SMA resistance stalls bulls near 213.00

Source Fxstreet
  • GBP/JPY retreats toward 211.78, remaining below critical SMA resistance.
  • RSI stays bullish but slopes lower, signaling weakening buying momentum.
  • Break below 211.19 exposes 50-day SMA at 210.03 and 209.13.

The GBP/JPY falls by about 0.22% as the US Dollar strengthens on hawkish comments from Federal Reserve (Fed) officials, boosting safe-haven currencies like the Japanese Yen against the Pound Sterling. The cross trades at 211.78.

GBP/JPY Price Forecast: Technical outlook

From a technical standpoint, the GBP/JPY continues to drift higher, though it remains below the crucial 100- and 200-day Simple Moving Averages (SMAs), each at 212.93 and 213.03, respectively. Momentum remains bullish, but buyers are losing traction as the Relative Strength Index (RSI) drifts lower.

For a bullish continuation, the first resistance for GBP/JPY is the 212.93-213.03 area. A breach of the latter will expose a resistance trendline near the past 213.20. Up next, the 214.00 figure emerges as the next area of interest, followed by the August 25 high at 217.48.

On the flip side, the first support is last Friday’s low of 211.19. Once cleared, the next stop is the 50-day SMA at 210.03, followed by the October 23 swing low of 209.13.

GBP/JPY Price Chart – Daily
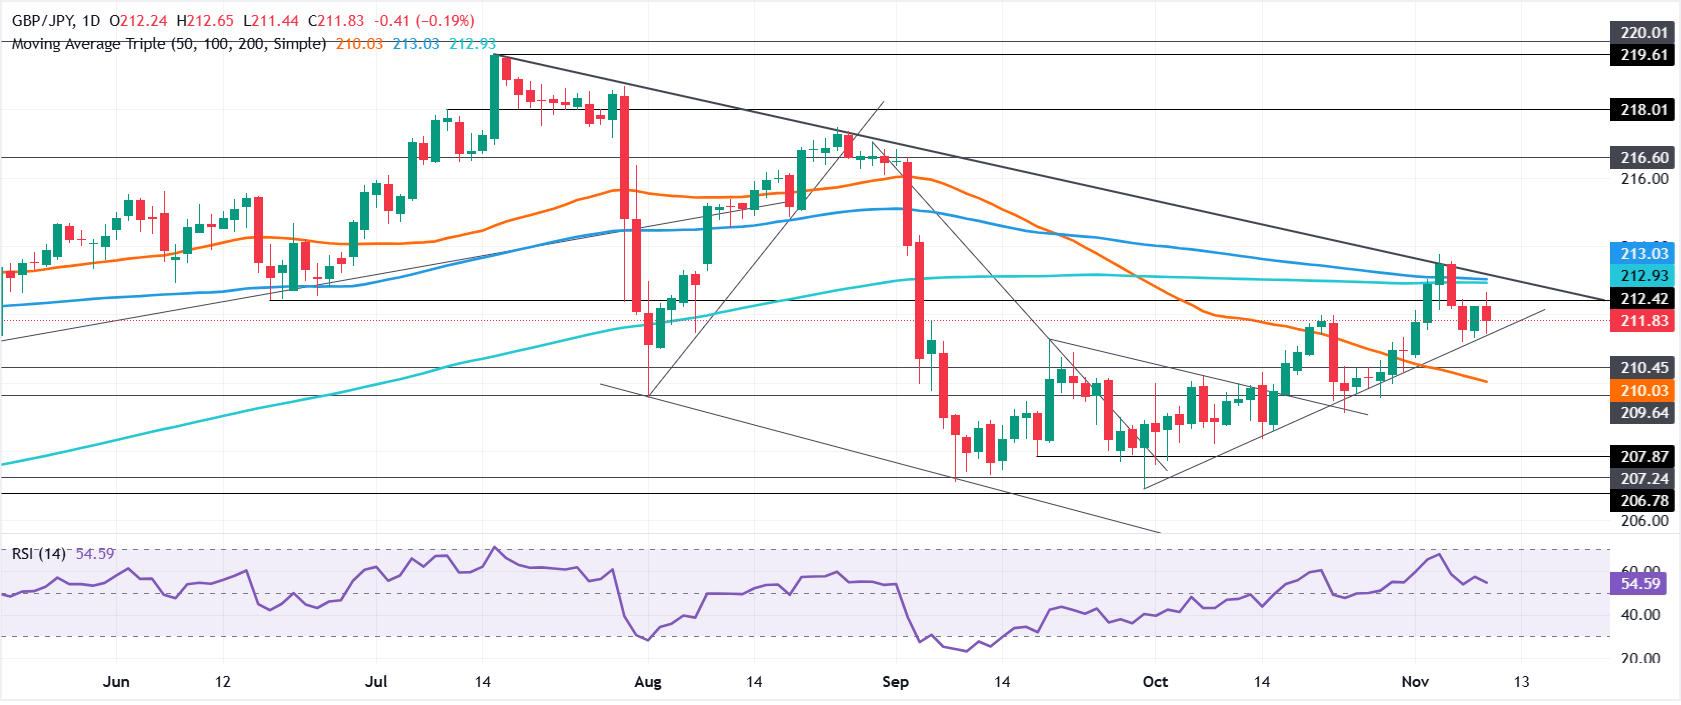
GBP/JPY daily chart

Japanese Yen Price Today

The table below shows the percentage change of Japanese Yen (JPY) against listed major currencies today. Japanese Yen was the strongest against the Australian Dollar.

USD EUR GBP JPY CAD AUD NZD CHF
USD 0.47% 0.70% 0.51% 0.49% 0.90% 0.50% 0.68%
EUR -0.47% 0.22% 0.04% 0.02% 0.42% 0.03% 0.21%
GBP -0.70% -0.22% -0.19% -0.18% 0.20% -0.23% -0.01%
JPY -0.51% -0.04% 0.19% -0.01% 0.40% -0.01% 0.18%
CAD -0.49% -0.02% 0.18% 0.00% 0.41% 0.00% 0.19%
AUD -0.90% -0.42% -0.20% -0.40% -0.41% -0.40% -0.22%
NZD -0.50% -0.03% 0.23% 0.00% -0.00% 0.40% 0.18%
CHF -0.68% -0.21% 0.01% -0.18% -0.19% 0.22% -0.18%

The heat map shows percentage changes of major currencies against each other. The base currency is picked from the left column, while the quote currency is picked from the top row. For example, if you pick the Japanese Yen from the left column and move along the horizontal line to the US Dollar, the percentage change displayed in the box will represent JPY (base)/USD (quote).

Disclaimer: For information purposes only. Past performance is not indicative of future results.
placeholder
Gold Price Analysis Today | Forex Gold Analysis | XAU/USD Analysis - November 11, 2026Get the latest gold price analysis, forex gold insights, and XAU/USD analysis for November 11, 2026. Read on for the details.
Author  Mitrade
Nov 11, Wed
Get the latest gold price analysis, forex gold insights, and XAU/USD analysis for November 11, 2026. Read on for the details.
placeholder
Nvidia slid 7.7% after hours while AMD and Broadcom rose — the AI trade changed hands, it didn't breakNvidia closed Wednesday at 173.73, up 2.87%, then fell as much as 8.1% to 159.44 after reports that its board was preparing for a possible leadership change. The same session, the Philadelphia Semiconductor Index rose 5.7% with all 30 components higher, CoreWeave jumped 24.7% on 168% revenue growth, and Micron added 11.9%. If AI demand were being repriced, AMD and Broadcom would not be bid. This is a governance discount on one name, and 204.54 — the 200-day average — is the level that settles it.
Author  Irene Q.
Nov 12, Thu
Nvidia closed Wednesday at 173.73, up 2.87%, then fell as much as 8.1% to 159.44 after reports that its board was preparing for a possible leadership change. The same session, the Philadelphia Semiconductor Index rose 5.7% with all 30 components higher, CoreWeave jumped 24.7% on 168% revenue growth, and Micron added 11.9%. If AI demand were being repriced, AMD and Broadcom would not be bid. This is a governance discount on one name, and 204.54 — the 200-day average — is the level that settles it.
placeholder
US October PPI Preview: Fed Rate Hike Expectations Rise, PPI May Be Key Variable; How Will US Stocks, Dollar, and Gold Move?On Friday (Nov. 13) Eastern Time, the U.S. will release the October Producer Price Index (PPI). Following the October CPI once again exceeding expectations, the market will look to the PP
Author  TradingKey
Nov 12, Thu
On Friday (Nov. 13) Eastern Time, the U.S. will release the October Producer Price Index (PPI). Following the October CPI once again exceeding expectations, the market will look to the PP
placeholder
Gold hit a one-year low while central banks bought 321 tonnes — the sellers were never the ones you thinkSpot gold closed at 3,876 on Thursday, down 2.8% and its lowest close in more than a year, with an intraday low near 3,852. The dollar is at a 19-month high of 103.21 and the 10-year yield is at 5.10%, so the price move is easy to explain. What is harder to explain is who sold: central banks bought 321 tonnes in Q3, the PBoC added for a 24th straight month, ETF holdings are near a record 4,256 tonnes, and roughly 95% of the futures selling came from non-reportable and sovereign-type accounts rather than hedge funds. This piece separates the two books that have to balance.
Author  Irene Q.
Yesterday 02: 40
Spot gold closed at 3,876 on Thursday, down 2.8% and its lowest close in more than a year, with an intraday low near 3,852. The dollar is at a 19-month high of 103.21 and the 10-year yield is at 5.10%, so the price move is easy to explain. What is harder to explain is who sold: central banks bought 321 tonnes in Q3, the PBoC added for a 24th straight month, ETF holdings are near a record 4,256 tonnes, and roughly 95% of the futures selling came from non-reportable and sovereign-type accounts rather than hedge funds. This piece separates the two books that have to balance.
placeholder
Brent rose 3.3% and US crude stocks built 4.66 million barrels in the same weekBrent January settled at 95.82, up 3.3%, and WTI at 88.74, up 2.55%, after the US signalled it would not pursue a deal with Iran and attacks on Gulf shipping continued. In the same week, EIA data showed US crude inventories rising 4.657 million barrels against expectations of a 1.1 million draw, with gasoline up another 1.799 million. OPEC output also rebounded 1.96 million barrels a day to 27.16 million in October, led by Saudi Arabia at 10.56 million. This piece separates the geopolitical premium from the physical balance and lays out where each side of the trade is anchored.
Author  Irene Q.
Yesterday 03: 06
Brent January settled at 95.82, up 3.3%, and WTI at 88.74, up 2.55%, after the US signalled it would not pursue a deal with Iran and attacks on Gulf shipping continued. In the same week, EIA data showed US crude inventories rising 4.657 million barrels against expectations of a 1.1 million draw, with gasoline up another 1.799 million. OPEC output also rebounded 1.96 million barrels a day to 27.16 million in October, led by Saudi Arabia at 10.56 million. This piece separates the geopolitical premium from the physical balance and lays out where each side of the trade is anchored.
Related Instrument
goTop
quote