


1.1100: Key support level for EUR/USD in countdown to US CPI data
- EUR/USD clings to gains near 1.1222 ahead of the US CPI data.
- Lower oil prices have remained a major drag on the US Dollar.
- Investors keenly await the US CPI data for October.
The Euro (EUR) holds onto the previous day’s gains at around 1.1222 against the US Dollar (USD) during the Asian trading session on Tuesday. The major currency pair reflects strength as the US Dollar comes under pressure due to falling oil prices, provided relief from heightened global inflation expectations.
As of writing, the US Dollar Index (DXY), which gauges the Greenback’s value against six major currencies, clings to the previous day’s losses near 101.67. Meanwhile, the WTI Oil price is down to near its over two-month low of $84.65 posted on Monday.
Dollar slide extends as oil retreat and US-Iran deal hopes weigh on support
Analysts at MUFG observe that the US Dollar has remained under pressure, with the currency “continu[ing] to weaken by the sharp decline in the price of oil, which is helping to ease market concerns over upside inflation risks. MUFG added that “overall, the latest developments have clearly boosted investor optimism over the prospect of a deal to end the US-Iran conflict,” arguing that “a less prolonged energy price shock would help to dampen the case for a stronger US dollar.”
Lower oil prices are also expected to weigh on expectations of prolonged Federal Reserve’s (Fed) monetary tightening.
Meanwhile, investors keenly await the United States (US) Consumer Price Index (CPI) data for October to get fresh cues regarding the current status of inflation, which will be published at 13:30 GMT. The US headline CPI on Wednesday is expected to arrive at 3.9% Year-on-Year (YoY), higher than the previous reading of 3.7%. The core CPI – which excludes volatile food and energy items – is also seen higher, arriving at 2.8% against the prior release of 2.6%.
On the Eurozone front, lower oil prices are supporting the Eurozone, given the continent is a big energy importer.
EUR/USD Technical Analysis
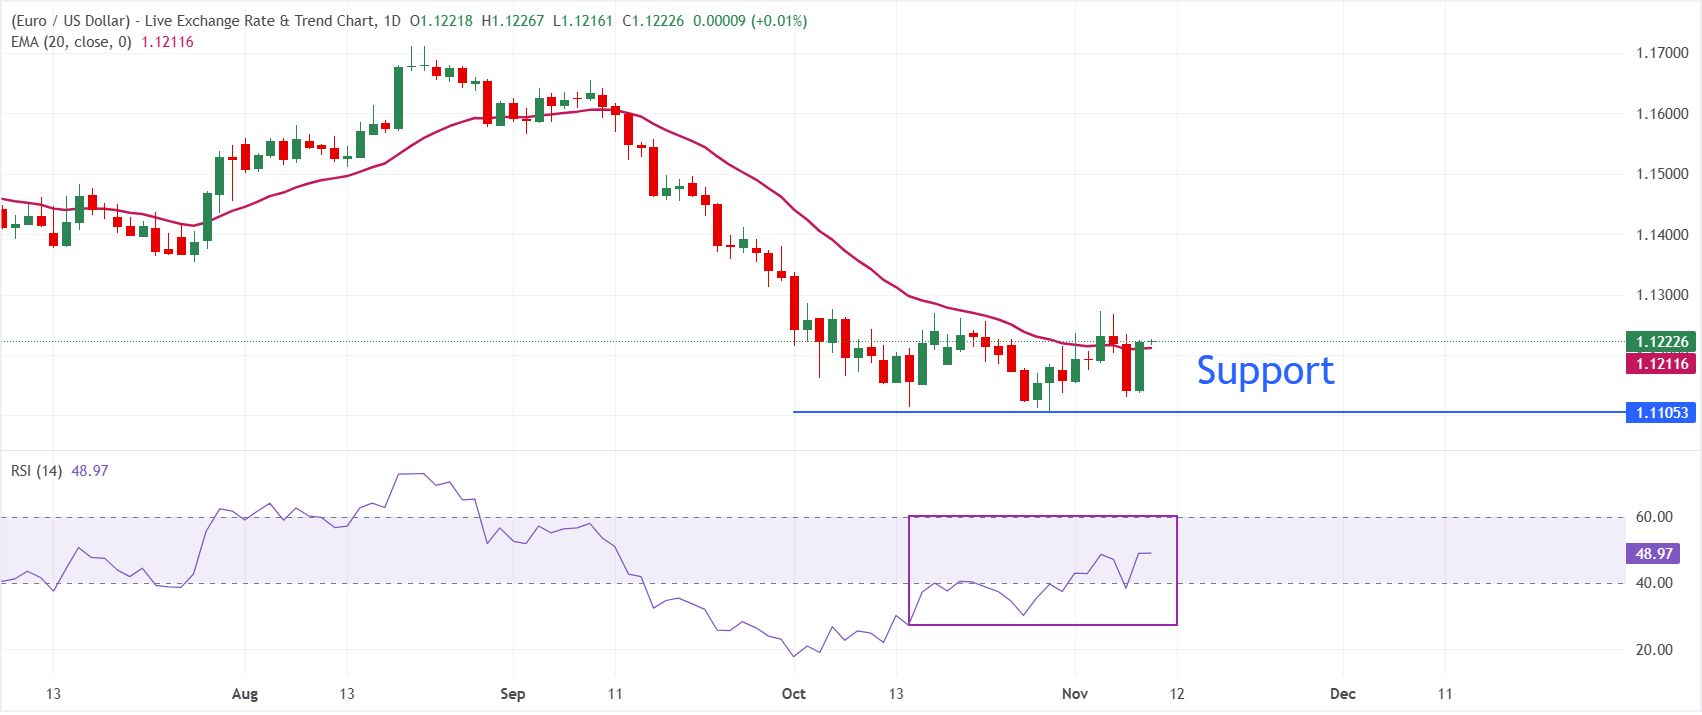
Trend: In the daily chart, EUR/USD trades at 1.1223. The pair is hovering close to the 20-day exponential moving average (EMA) at 1.1212, keeping the immediate tone broadly neutral.
Momentum: The Relative Strength Index (RSI) at 48.97 sits near the midline, hinting at balanced momentum with neither buyers nor sellers in clear control for now.
Support: On the downside, the Monday's low at 1.1138 is the immediate support ahead of the major cushion at 1.1104. A break below the latter would expose the pair to 1.1000.
Resistance: On the topside, the November 4 high at 1.1273 seems the major hurdle for the pair.
(The technical analysis of this story was written with the help of an AI tool. Know more.)
Inflation FAQs
Inflation measures the rise in the price of a representative basket of goods and services. Headline inflation is usually expressed as a percentage change on a month-on-month (MoM) and year-on-year (YoY) basis. Core inflation excludes more volatile elements such as food and fuel which can fluctuate because of geopolitical and seasonal factors. Core inflation is the figure economists focus on and is the level targeted by central banks, which are mandated to keep inflation at a manageable level, usually around 2%.
The Consumer Price Index (CPI) measures the change in prices of a basket of goods and services over a period of time. It is usually expressed as a percentage change on a month-on-month (MoM) and year-on-year (YoY) basis. Core CPI is the figure targeted by central banks as it excludes volatile food and fuel inputs. When Core CPI rises above 2% it usually results in higher interest rates and vice versa when it falls below 2%. Since higher interest rates are positive for a currency, higher inflation usually results in a stronger currency. The opposite is true when inflation falls.
Although it may seem counter-intuitive, high inflation in a country pushes up the value of its currency and vice versa for lower inflation. This is because the central bank will normally raise interest rates to combat the higher inflation, which attract more global capital inflows from investors looking for a lucrative place to park their money.
Formerly, Gold was the asset investors turned to in times of high inflation because it preserved its value, and whilst investors will often still buy Gold for its safe-haven properties in times of extreme market turmoil, this is not the case most of the time. This is because when inflation is high, central banks will put up interest rates to combat it. Higher interest rates are negative for Gold because they increase the opportunity-cost of holding Gold vis-a-vis an interest-bearing asset or placing the money in a cash deposit account. On the flipside, lower inflation tends to be positive for Gold as it brings interest rates down, making the bright metal a more viable investment alternative.
Recommended Articles


