


Euro retreats from day’s high as US Dollar rebounds, German HICP data awaited
- Euro corrects from 1.1215 to near 1.1188 as the US Dollar regains ground.
- US GDP growth remained stronger-than-projected in the July-September period.
- Investors keenly await the flash German HICP data for October.
The Euro (EUR) gives back a majority of its early gains against the US Dollar (USD) on Friday. The EUR/USD pair corrects after failing to extend gains above 1.1215, but is still 0.11% higher at around 1.1188 in the European trade.
The pair retreats as the US Dollar claws back a majority of its early losses, as the combination of strong United States (US) economic growth and high inflation fears has strengthened the case of Federal Reserve’s (Fed) interest rate hike in December.
As of writing, the US Dollar Index (DXY), which gauges the Greenback’s value against six major currencies, trades 0.1% down to near 101.72, but has recovered from its day’s low of 101.59.
On Thursday, the US preliminary Q3 Gross Domestic Product (GDP) data came in stronger-than-expected. Economists at Commerzbank highlight that the US economy “expanded strongly by 3.4% in the third quarter of 2026,” with the Q3 GDP advance estimate coming in at “3.4% qoq annualised (Bloomberg consensus: 3.2%) vs 2.2% in Q2.” They note that “private consumption was the main driver and expanded 3.8%, at the same pace as Q2,” while “business investment, particularly in IT,” also contributed significantly to the robust outturn.
Meanwhile, the US core PCE Inflation, which strips of volatile food and energy items, and is a Fed’s preferred inflation gauge, grew by 3.1% Year-on-Year (YoY), in line with expectations, and faster than the August reading of 3%.
On the Euro front, investors await the preliminary German Harmonized Index of Consumer Prices (HICP) data for October, which will be published at 13:00 GMT. The headline HICP growth in Germany is expected to have cooled down to 3.1% Year-on-Year (YoY) from 3.3% in September.
EUR/USD Technical Analysis
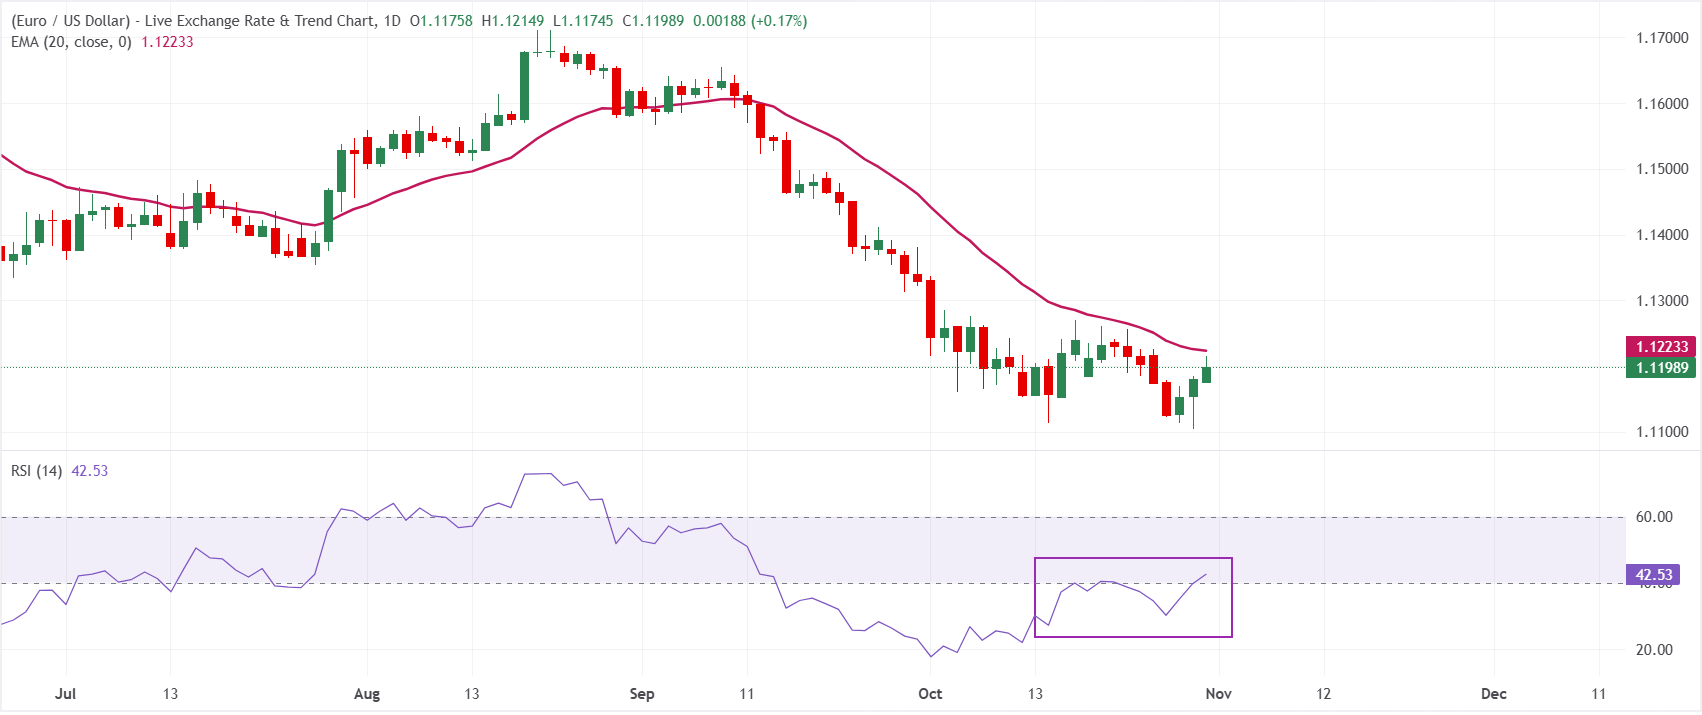
In the daily chart, EUR/USD trades at 1.1199, keeping a mildly bearish near-term tone as it holds beneath the 20-period exponential moving average (EMA) at 1.1223. The pair’s inability to reclaim this short-term EMA suggests upside remains capped for now, while the Relative Strength Index (RSI) at 42 stays below the neutral 50 mark, hinting at subdued bullish momentum despite the recent stabilization off oversold readings.
On the topside, immediate resistance is located at the 20-period EMA around 1.1223, where sustained rejection would likely maintain the downside bias and favor further consolidation or a retest of recent lows. A clear daily close above this moving average would be needed to ease bearish pressure and open the way for a stronger corrective recovery, with momentum indicators then likely to strengthen in tandem.
(The technical analysis of this story was written with the help of an AI tool. Know more.)
Economic Indicator
Harmonized Index of Consumer Prices (YoY)
The Harmonized Index of Consumer Prices (HICP), released by the German statistics office Destatis on a monthly basis, is an index of inflation based on a statistical methodology that has been harmonized across all European Union (EU) member states to facilitate comparisons. The YoY reading compares prices in the reference month to a year earlier. Generally, a high reading is bullish for the Euro (EUR), while a low reading is bearish.
Read more.Next release: Fri Oct 30, 2026 13:00 (Prel)
Frequency: Monthly
Consensus: 3.1%
Previous: 3.3%
Source: Federal Statistics Office of Germany
Recommended Articles


