


Indian Rupee continues to face pressure from Middle East risks
- The Indian Rupee faces pressure as oil prices gain sharply.
- TD Securities expects oil prices to retain a risk premium amid ongoing Middle East risks.
- Both the US Dollar and US Treasury Yields are seen regaining ground.
The Indian Rupee (INR) remains under pressure against the US Dollar (USD), as oil prices continue to boil due to Middle East risks. In the opening trade on Friday, the USD/INR pair is slightly higher to near 95.25, closer to its over two-week high of 95.38 posted the previous day.
In early trading on Friday, the MCX Crude Oil contract expiring on November 19 jumps to near its recent highs of Rs. 9,873.
Higher oil prices bode poorly for currencies from economies, such as India, given their significant reliance on oil imports to meet their energy needs.
Crude trades under headline pressure but risk premium keeps energy supported
According to TD Securities, a "deal headline barrage" ahead of the US midterm elections is exerting notable pressure on crude, with "persistent headlines of deal talks" weighing on the market. The bank expects this dynamic to persist into the vote, but adds that it does not anticipate that Iran would agree to a deal "just before the tense elections."
At the same time, TD Securities stresses that "on the ground, the fundamentals remain tight," pointing to tanker attacks and Houthi pressure, which "appear to have been successful in reducing Mideast flows, at least temporarily." The bank argues that "so long as continued attacks keep a risk premium in the market, energy prices should remain well-supported in this higher range."
US Dollar and US bond yields regain ground
Signs from price action in the US Dollar and US Treasury Yields that both are regaining ground are also lending strength to the USD/INR pair.
The US Dollar Index (DXY), which gauges the Greenback’s value against six major currencies, recovers a majority of its early losses and trades around 101.78 at press time. Earlier in the day, the USD Index declined to 101.59.
As of writing, 10-year US Treasury Yields are down 0.24% to near 4.93%, but they have clawed back majority of early losses after sliding to a fresh seven-week low at 4.89%.
The US Dollar and bond yields came under pressure even though preliminary United States (US) Q3 Gross Domestic Product (GDP) growth remained stronger than expected and the core Personal Consumer Expenditures (PCE) Price Index, which is Federal Reserve’s (Fed) preferred inflation gauge, elevated further.
On Tuesday, the Bureau of Economic Analysis (BEA) reported that the economy expanded at an annualized pace of 3.4%, faster than estimates of 3.2% and the prior release of 2.2%.
The US core PCE Inflation rose by 3.1% Year-on-Year (YoY) in September, in line with expectations, and higher than the August reading of 3%. On a monthly basis, the growth was similar to estimates and the prior release of 0.3%.
USD/INR Technical Analysis
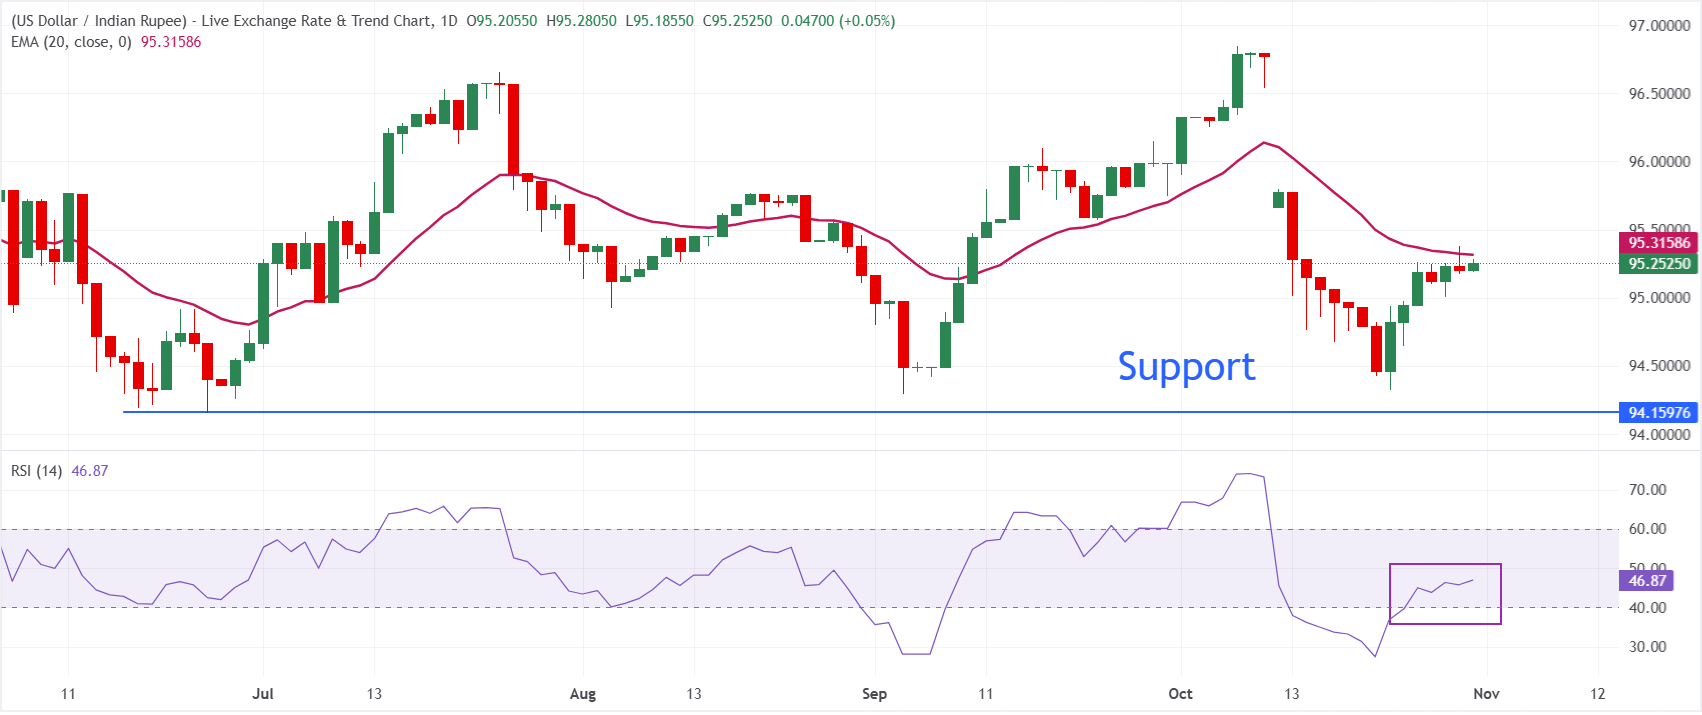
In the daily chart, USD/INR trades at 95.25, maintaining a mildly bearish near-term bias as spot holds below the 20-period exponential moving average (EMA) at 95.32. The pair has retreated from late-September highs and the loss of the short-term EMA suggests upside attempts are being capped, while the Relative Strength Index (RSI) at 46.94 hovers just below neutral, hinting at fading bullish momentum rather than outright oversold conditions.
On the topside, immediate resistance is located at the 20-day EMA near 95.32, followed by 96.00. Looking down, the June 25 low at 94.16 is the key support level.
(The technical analysis of this story was written with the help of an AI tool. Know more.)
Indian Rupee FAQs
The Indian Rupee (INR) is one of the most sensitive currencies to external factors. The price of Crude Oil (the country is highly dependent on imported Oil), the value of the US Dollar – most trade is conducted in USD – and the level of foreign investment, are all influential. Direct intervention by the Reserve Bank of India (RBI) in FX markets to keep the exchange rate stable, as well as the level of interest rates set by the RBI, are further major influencing factors on the Rupee.
The Reserve Bank of India (RBI) actively intervenes in forex markets to maintain a stable exchange rate, to help facilitate trade. In addition, the RBI tries to maintain the inflation rate at its 4% target by adjusting interest rates. Higher interest rates usually strengthen the Rupee. This is due to the role of the ‘carry trade’ in which investors borrow in countries with lower interest rates so as to place their money in countries’ offering relatively higher interest rates and profit from the difference.
Macroeconomic factors that influence the value of the Rupee include inflation, interest rates, the economic growth rate (GDP), the balance of trade, and inflows from foreign investment. A higher growth rate can lead to more overseas investment, pushing up demand for the Rupee. A less negative balance of trade will eventually lead to a stronger Rupee. Higher interest rates, especially real rates (interest rates less inflation) are also positive for the Rupee. A risk-on environment can lead to greater inflows of Foreign Direct and Indirect Investment (FDI and FII), which also benefit the Rupee.
Higher inflation, particularly, if it is comparatively higher than India’s peers, is generally negative for the currency as it reflects devaluation through oversupply. Inflation also increases the cost of exports, leading to more Rupees being sold to purchase foreign imports, which is Rupee-negative. At the same time, higher inflation usually leads to the Reserve Bank of India (RBI) raising interest rates and this can be positive for the Rupee, due to increased demand from international investors. The opposite effect is true of lower inflation.
Recommended Articles


