


NZD/USD Price Forecast: Kiwi tests YTD lows at 0.5683 in cautious markets
- NZD/USD extends losses below 0.5700, approaching YTD lows at 0.5683.
- A mix of scepticism about the US-Iran peace deal and rising bets of Fed hikes is crushing the pair.
- Bears might push the Kiwi towards the target of a Double Top pattern in the 0.5640 area.
The New Zealand Dollar (NZD) extends losses against the US Dollar (USD) for the fifth consecutive day on Tuesday, reaching levels sub-0.5700, and approaching year-to date lows, at 0.5683. The risk-sensitive Kiwi is struggling with markets sceptical about the advances in the US-Iran peace deal.
Iranian negotiators affirmed earlier on Tuesday that the technical talks have concluded, but there is no clear plan or concrete data to reopen the Strait of Hormuz, a critical waterway for approximately 20% of the global Crude Oil supply.
The US Dollar is also drawing support from higher US Treasury yields, as traders brace for Federal Reserve (Fed) rate hikes later in the year. The CME Group’s Fed Watch Tool shows a 70% chance of a hike in September, up from less than 30% a year ago, and is almost fully pricing at least a quarter-point hike before the end of the year.
Technical Analysis: Below 0.5683, the target is the 0.5640 area
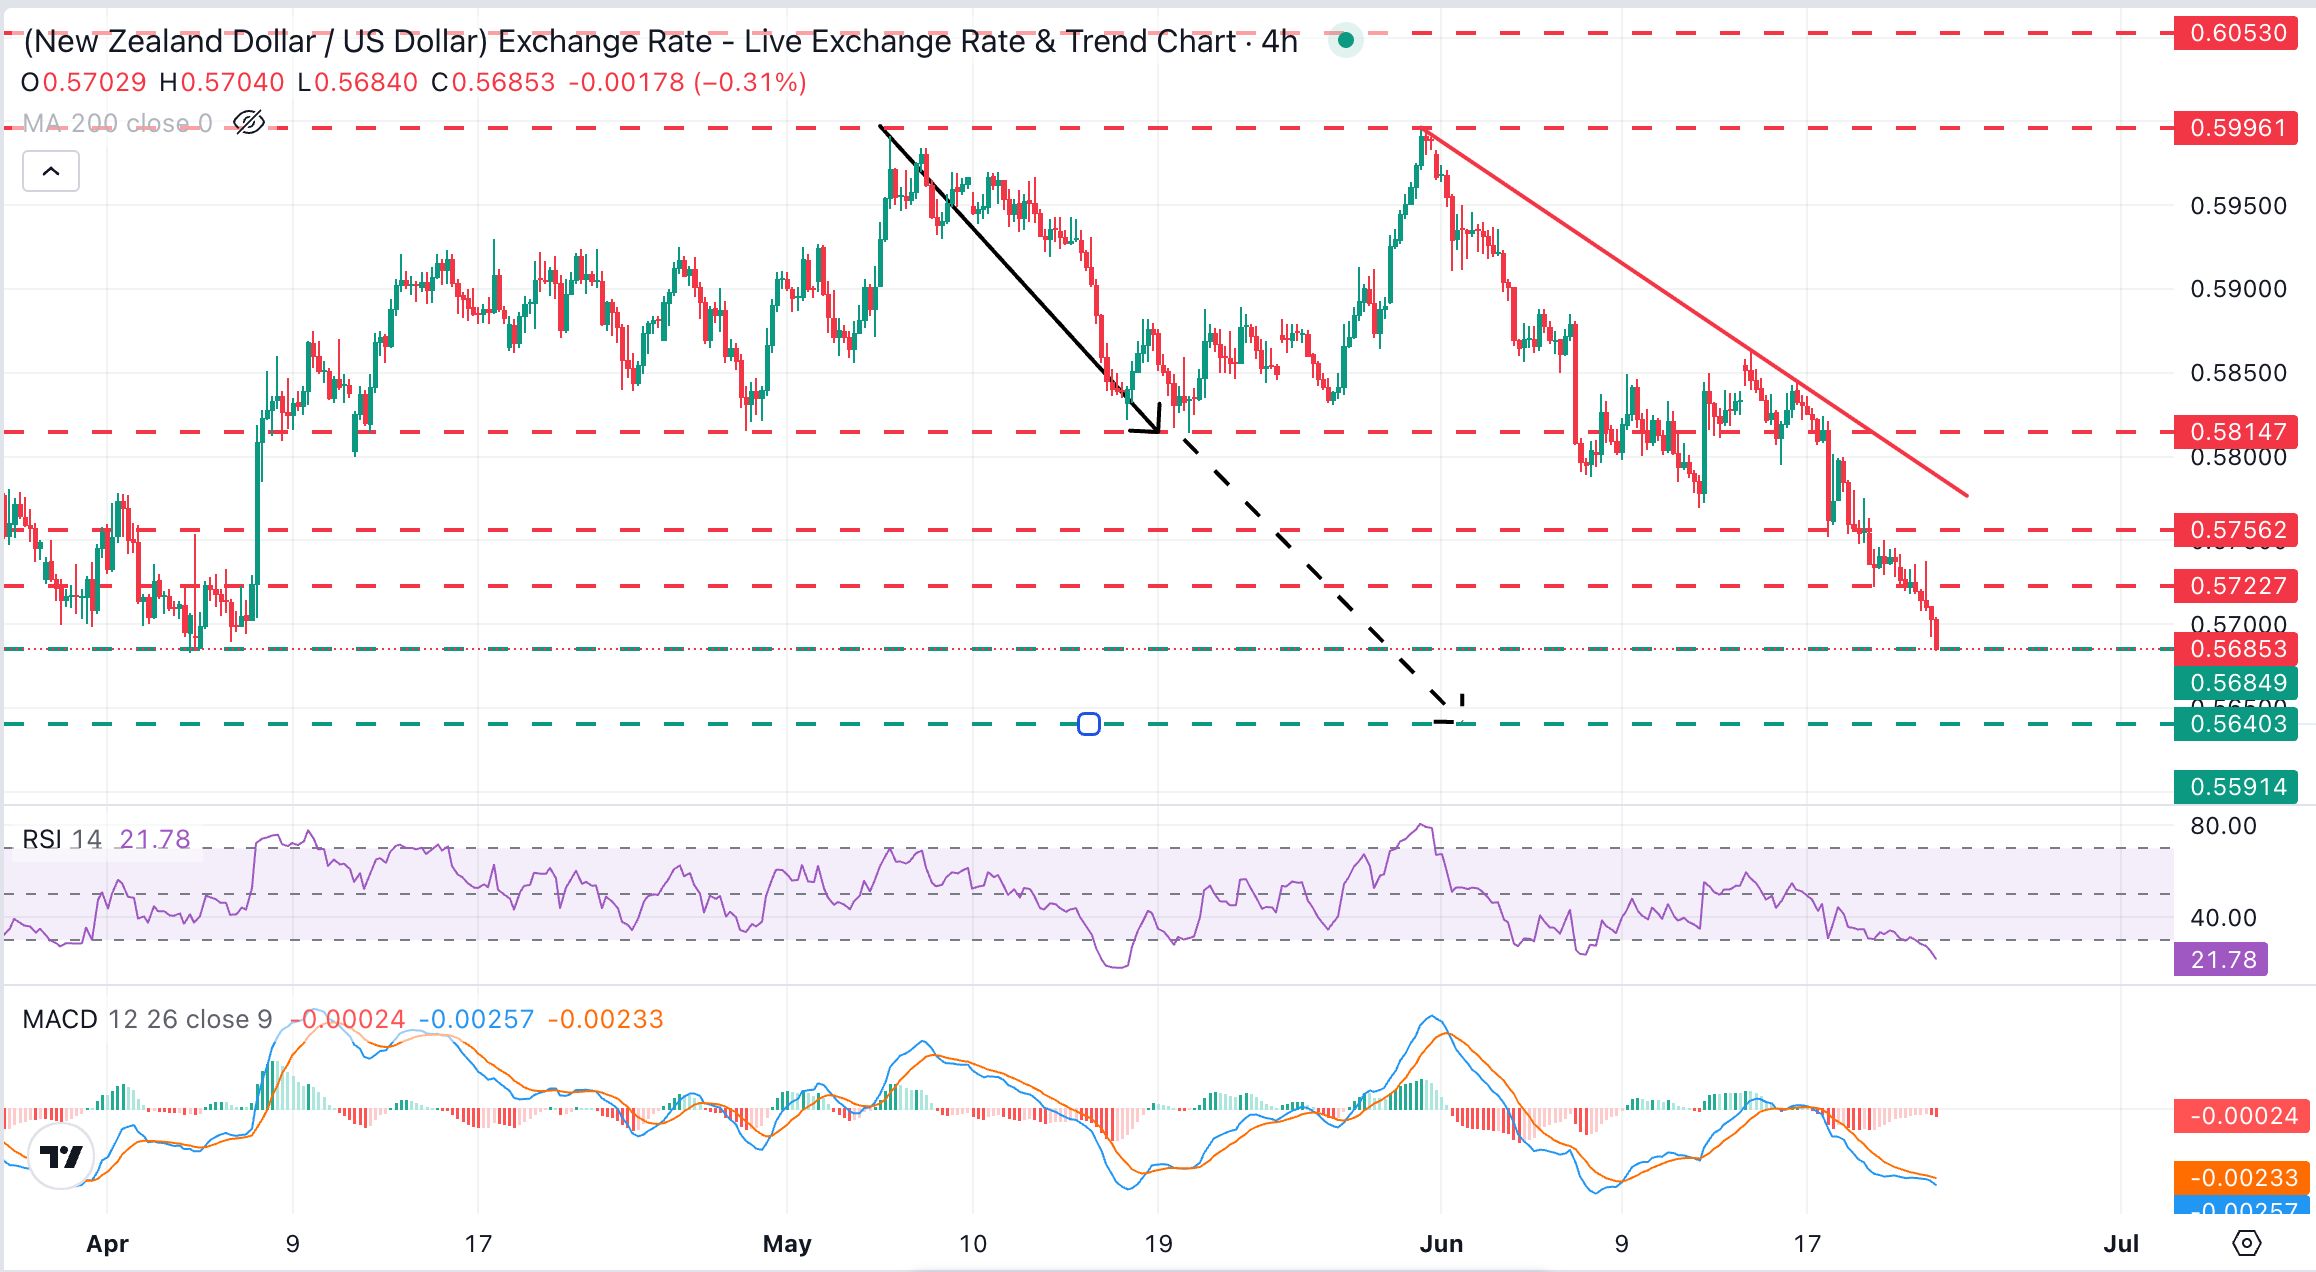
NZD/USD trades at 0.5685, extending a bearish tone after breaching the psychological 0.5700 level. Momentum indicators in 4-hour charts endorse the bearish view. The Moving Average Convergence Divergence (MACD) is slightly negative, while the Relative Strength Index (14) has reached oversold conditions, highlighting a stretched cycle, yet with no convincing sign of a reversal on sight.
Initial support is at the mentioned April low, at 0.5680, although bears might be tempted to push the pair all the way to the measured target of May's Double Top pattern, at the 0.8640 area.
On the upside, previous support levels near 0.5725 (June 19 low) and 0.5755 (June 17 low) are likely to test bulls ahead of the descending trendline, now at the 0.5780 area.
(The technical analysis of this story was written with the help of an AI tool.)
New Zealand Dollar Price Today
The table below shows the percentage change of New Zealand Dollar (NZD) against listed major currencies today. New Zealand Dollar was the strongest against the Australian Dollar.
| USD | EUR | GBP | JPY | CAD | AUD | NZD | CHF | |
|---|---|---|---|---|---|---|---|---|
| USD | 0.05% | 0.15% | 0.06% | 0.19% | 0.74% | 0.48% | 0.06% | |
| EUR | -0.05% | 0.09% | 0.00% | 0.12% | 0.67% | 0.42% | -0.02% | |
| GBP | -0.15% | -0.09% | -0.06% | 0.05% | 0.59% | 0.33% | -0.10% | |
| JPY | -0.06% | 0.00% | 0.06% | 0.13% | 0.68% | 0.43% | -0.03% | |
| CAD | -0.19% | -0.12% | -0.05% | -0.13% | 0.56% | 0.31% | -0.14% | |
| AUD | -0.74% | -0.67% | -0.59% | -0.68% | -0.56% | -0.23% | -0.69% | |
| NZD | -0.48% | -0.42% | -0.33% | -0.43% | -0.31% | 0.23% | -0.46% | |
| CHF | -0.06% | 0.02% | 0.10% | 0.03% | 0.14% | 0.69% | 0.46% |
The heat map shows percentage changes of major currencies against each other. The base currency is picked from the left column, while the quote currency is picked from the top row. For example, if you pick the New Zealand Dollar from the left column and move along the horizontal line to the US Dollar, the percentage change displayed in the box will represent NZD (base)/USD (quote).
Recommended Articles


