

USD/JPY Price Forecast: Likely extend advance towards 20-day EMA amid firm US Dollar
- USD/JPY jumps to near 157.60 as the US Dollar outperforms amid renewed US-Iran tensions.
- US Treasury Secretary Bessent confirmed a joint effort with Japan against forex volatility.
- Investors await the US CPI data for April.
The USD/JPY pair trades 0.26% higher to near 157.60 during the European trading session on Tuesday. The pair gains as the US Dollar (USD) outperforms its peers due to renewed tensions between the United States (US) and Iran.
US Dollar Price Today
The table below shows the percentage change of US Dollar (USD) against listed major currencies today. US Dollar was the strongest against the British Pound.
| USD | EUR | GBP | JPY | CAD | AUD | NZD | CHF | |
|---|---|---|---|---|---|---|---|---|
| USD | 0.32% | 0.51% | 0.17% | 0.19% | 0.28% | 0.21% | 0.36% | |
| EUR | -0.32% | 0.19% | -0.11% | -0.16% | -0.03% | -0.12% | 0.04% | |
| GBP | -0.51% | -0.19% | -0.34% | -0.36% | -0.24% | -0.32% | -0.14% | |
| JPY | -0.17% | 0.11% | 0.34% | -0.04% | 0.06% | -0.00% | 0.15% | |
| CAD | -0.19% | 0.16% | 0.36% | 0.04% | 0.10% | 0.03% | 0.18% | |
| AUD | -0.28% | 0.03% | 0.24% | -0.06% | -0.10% | -0.06% | 0.09% | |
| NZD | -0.21% | 0.12% | 0.32% | 0.00% | -0.03% | 0.06% | 0.15% | |
| CHF | -0.36% | -0.04% | 0.14% | -0.15% | -0.18% | -0.09% | -0.15% |
The heat map shows percentage changes of major currencies against each other. The base currency is picked from the left column, while the quote currency is picked from the top row. For example, if you pick the US Dollar from the left column and move along the horizontal line to the Japanese Yen, the percentage change displayed in the box will represent USD (base)/JPY (quote).
As of writing, the US Dollar Index (DXY), which gauges the Greenback’s value against six major currencies, is up 0.4% to near 98.30.
Market participants doubt that the US and Iran will have a permanent resolution in the near term, as President Donald Trump stated on Monday that Iran’s proposal was a “stupid proposal” and Tehran’s decision regarding pursuing its nuclear ambitions remained absent. Trump added, “Ceasefire is on life support.”
During the day, the pair faced a knee-jerk reaction as the Japanese Yen (JPY) gained sharply after US Treasury Secretary Scott Bessent confirmed joint efforts with Japan against excessive volatility in currency markets. “We both believe forex volatility is undesirable,” US Treasury Secretary Bessent said.
Meanwhile, investors await the US Consumer Price Index (CPI) data for April, which will be published at 12:30 GMT. Investors will pay close attention to the US inflation data to get fresh cues regarding the Federal Reserve’s (Fed) monetary policy outlook.
USD/JPY technical analysis
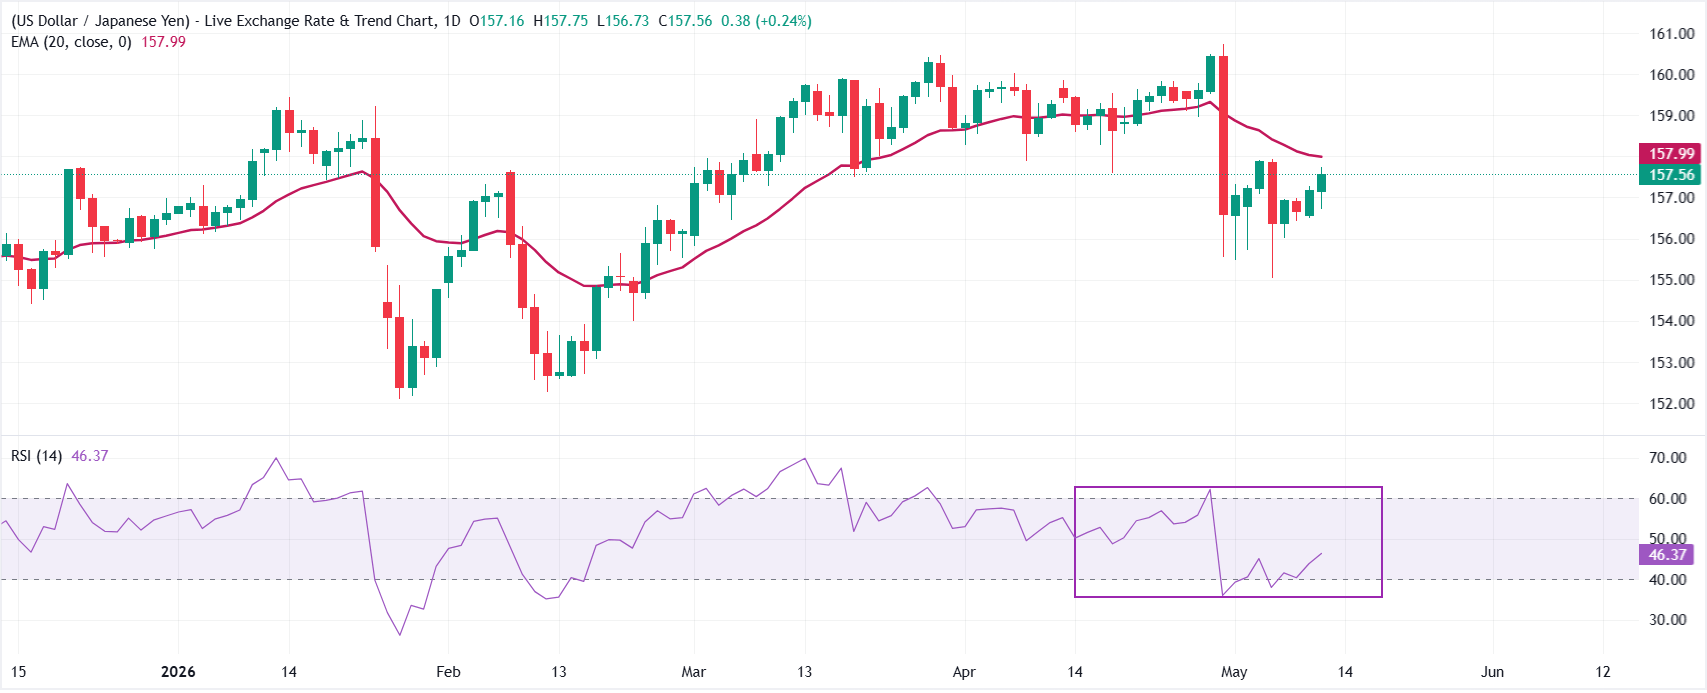
USD/JPY trades higher at around 157.60, but is still keeping a bearish near-term tone as it holds below the 20-day Exponential Moving Average (EMA) at 157.99. The pair's sustenance under this short-term trend gauge, suggesting rallies remain capped for now, while the Relative Strength Index (RSI) around 47 hints at fading bullish momentum rather than outright oversold conditions.
On the topside, immediate resistance is located at the 20-day EMA near 158.00, and a daily close above this barrier would be needed to ease the current downside pressure. A decisive break above the 20-day EMA would allow the pair to extend the advance toward the April 28 low of 159.00. Looking down, key support levels are the May 11 low at 156.50 and the May 7 low at around 156.00.
(The technical analysis of this story was written with the help of an AI tool.)
Economic Indicator
Consumer Price Index (YoY)
Inflationary or deflationary tendencies are measured by periodically summing the prices of a basket of representative goods and services and presenting the data as The Consumer Price Index (CPI). CPI data is compiled on a monthly basis and released by the US Department of Labor Statistics. The YoY reading compares the prices of goods in the reference month to the same month a year earlier.The CPI is a key indicator to measure inflation and changes in purchasing trends. Generally speaking, a high reading is seen as bullish for the US Dollar (USD), while a low reading is seen as bearish.
Read more.Next release: Tue May 12, 2026 12:30
Frequency: Monthly
Consensus: 3.7%
Previous: 3.3%
Source: US Bureau of Labor Statistics
The US Federal Reserve (Fed) has a dual mandate of maintaining price stability and maximum employment. According to such mandate, inflation should be at around 2% YoY and has become the weakest pillar of the central bank’s directive ever since the world suffered a pandemic, which extends to these days. Price pressures keep rising amid supply-chain issues and bottlenecks, with the Consumer Price Index (CPI) hanging at multi-decade highs. The Fed has already taken measures to tame inflation and is expected to maintain an aggressive stance in the foreseeable future.
Recommended Articles


