

Crypto Today: Bitcoin, Ethereum, XRP stuck below key supply zones ahead of US inflation report
- Bitcoin extends its correction for the second consecutive day, as investors remain cautious ahead of the US CPI data release.
- Ethereum trades between the 100-day EMA resistance and the 50-day EMA support amid ETF outflows.
- XRP extends sideways action above the pivotal $1.45 level as retail demand steadies.
Cryptocurrency prices are struggling due to mounting overhead pressure on Tuesday, and traders await the release of April’s US inflation data. Bitcoin (BTC) hovers below $81,000, with support at $80,000 holding at the time of writing.
Altcoins, including Ethereum (ETH) and Ripple (XRP), appear to be grinding lower just like Bitcoin, with ETH trading below $2,300 and XRP above the pivotal $1.45 level.
Crypto market sentiment stable ahead of US CPI report
The US Bureau of Labor Statistics (BLS) is expected to release the Consumer Price Index (CPI) report for April on Tuesday. This is the primary inflation indicator in the United States (US), measuring the average change in prices of goods and services, including food, housing and transportation over time.
The CPI in March came in hotter than expected, with headline inflation at 3.3% YoY, up from 2.4% in February during the same period. Excluding volatile food and energy prices, the core CPI rose to 2.6% YoY in March, up from the previous 2.5%. Markets expect CPI to rise year-on-year by 3.7% in April, while the core reading is forecast at 2.7%.
Softer inflation data could raise optimism for interest rate cuts by the Federal Reserve (Fed) in 2026. That said, escalating tensions between the US and Iran in the Middle East have triggered a global surge in oil prices, materially heightening the probability of inflation printing above expectations.
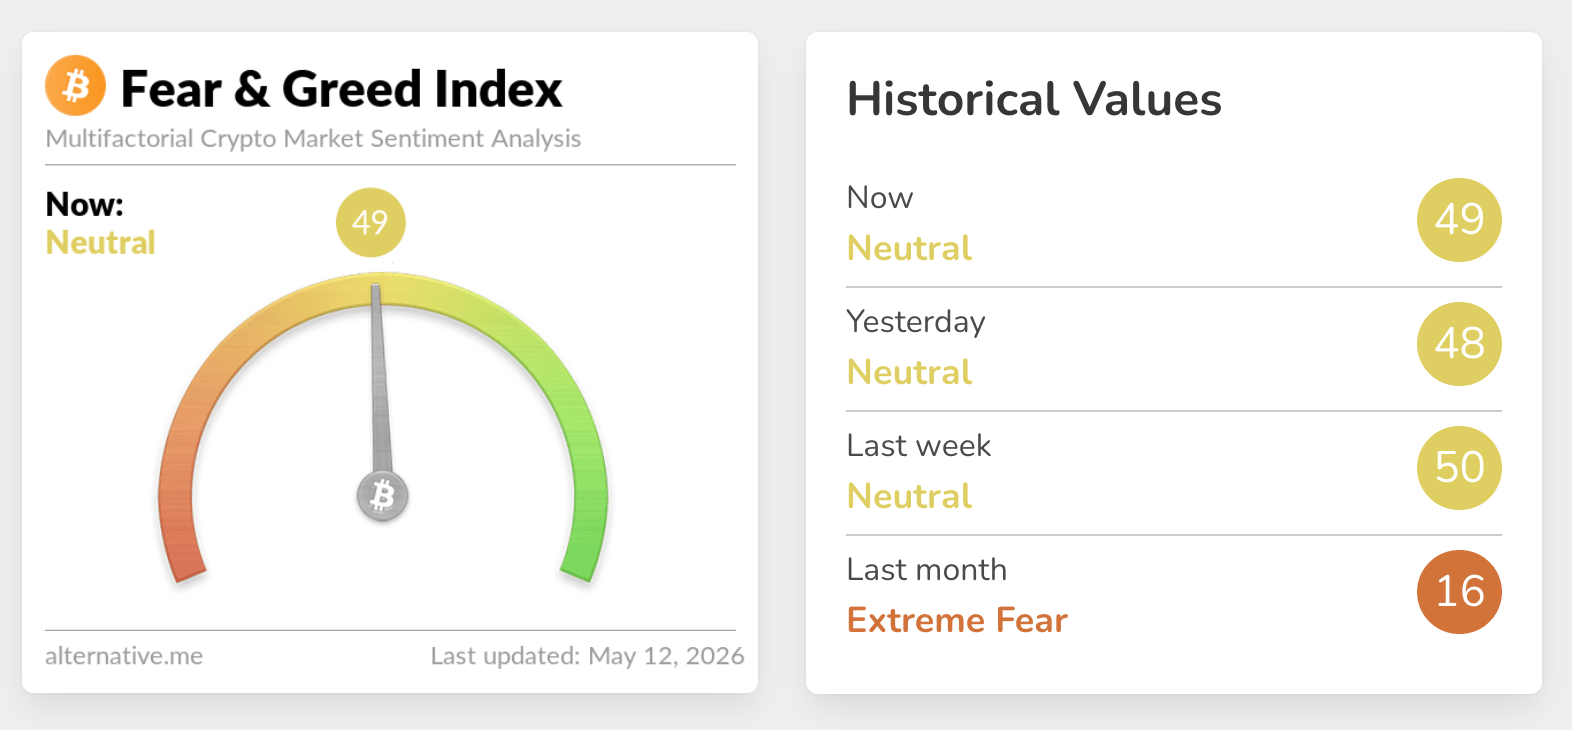
Turning to risk appetite, market sentiment remains steady, as reflected by the Crypto Fear & Greed Index rising to 49 in the fear territory on Tuesday, up from 48 the previous day.
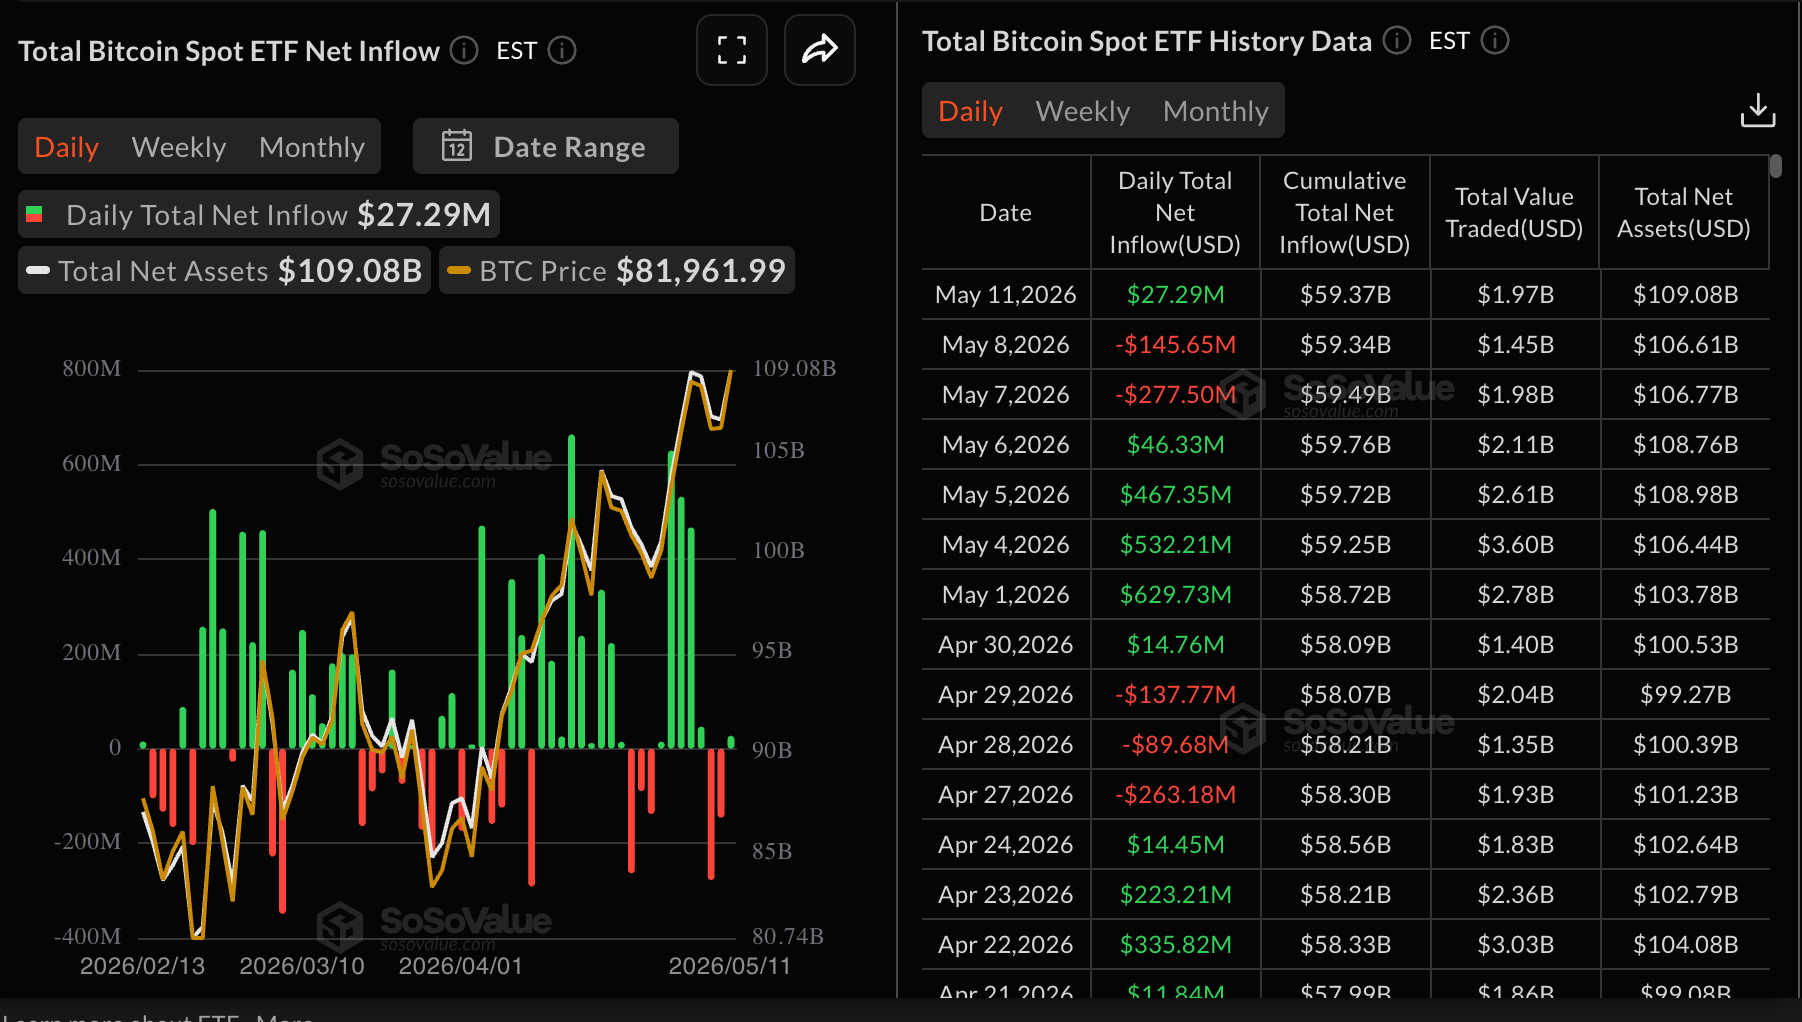
Bitcoin spot Exchange-Traded Funds (ETFs) experienced mild inflows of roughly $27 million on Monday, breaking a two-day bearish streak, according to SoSoValue data. Cumulative inflows now stand at $59.37 billion, with net assets averaging $109.08 billion.
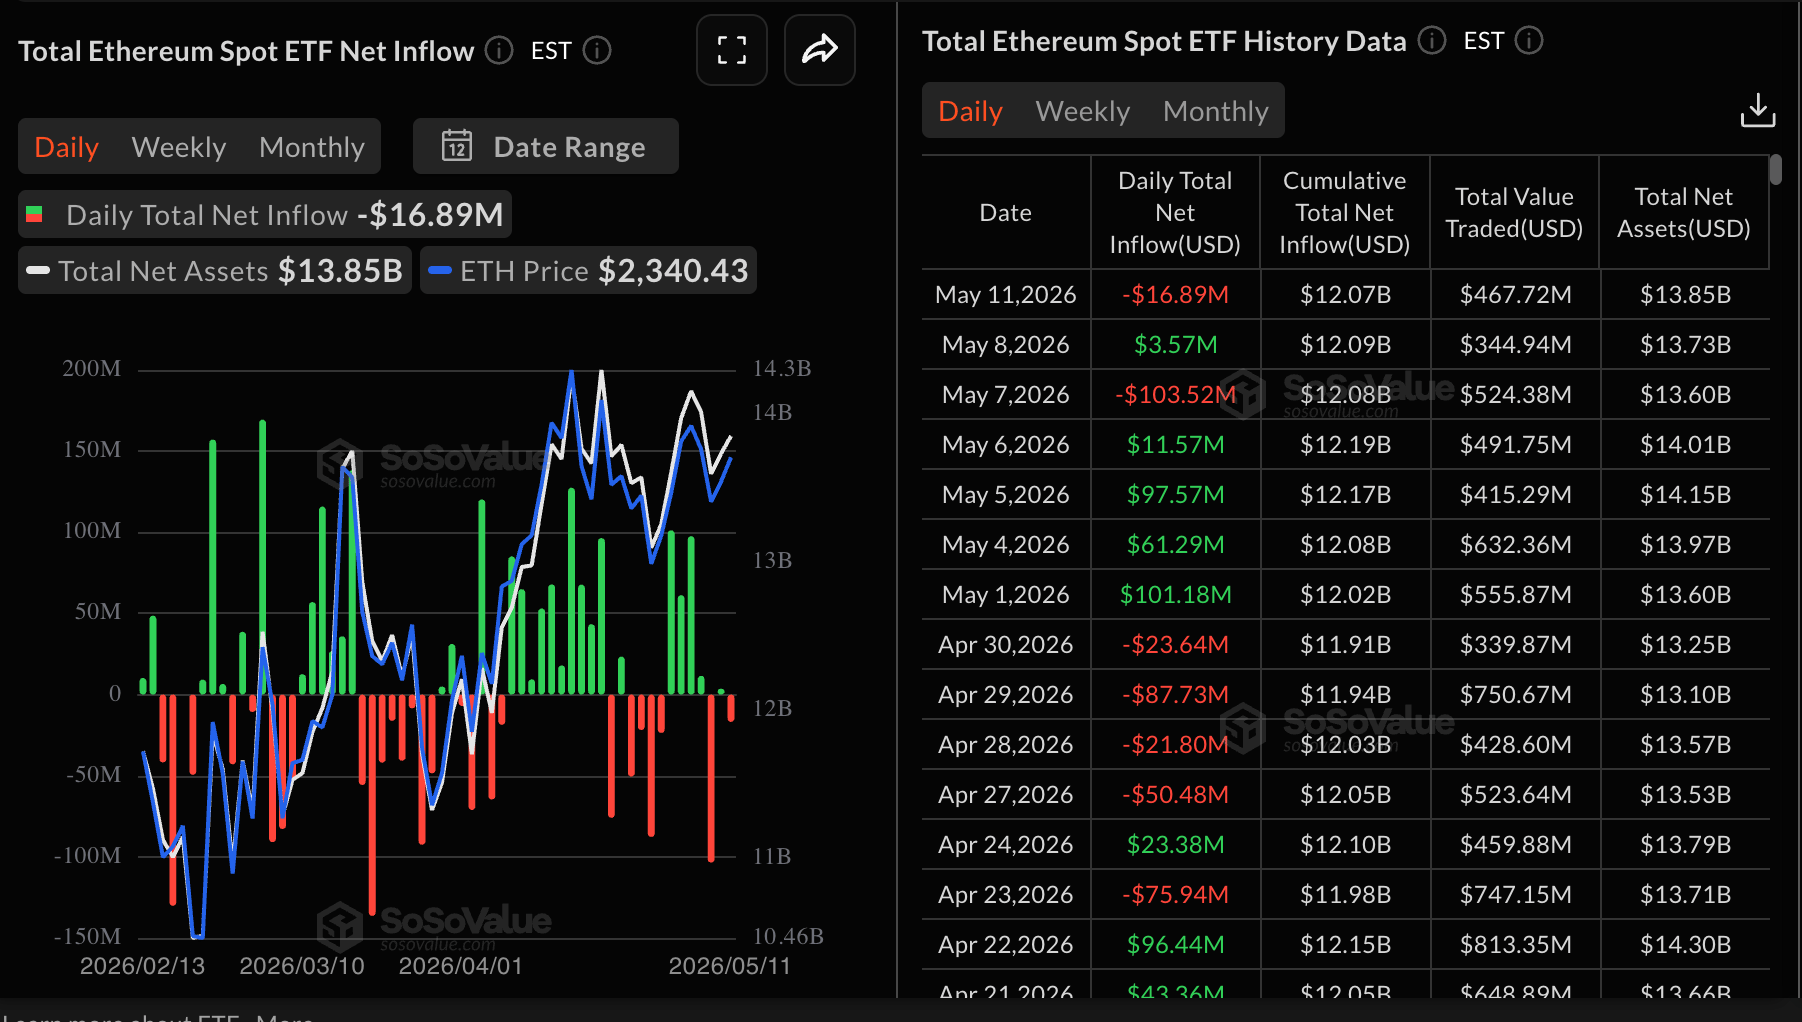
Ethereum spot ETFs continued to see significant pressure, recording almost $17 million in outflows on Monday. While Friday brought some relief with inflows of $3.57 million, this was a modest rebound from the substantial $104 million outflow observed on Thursday.
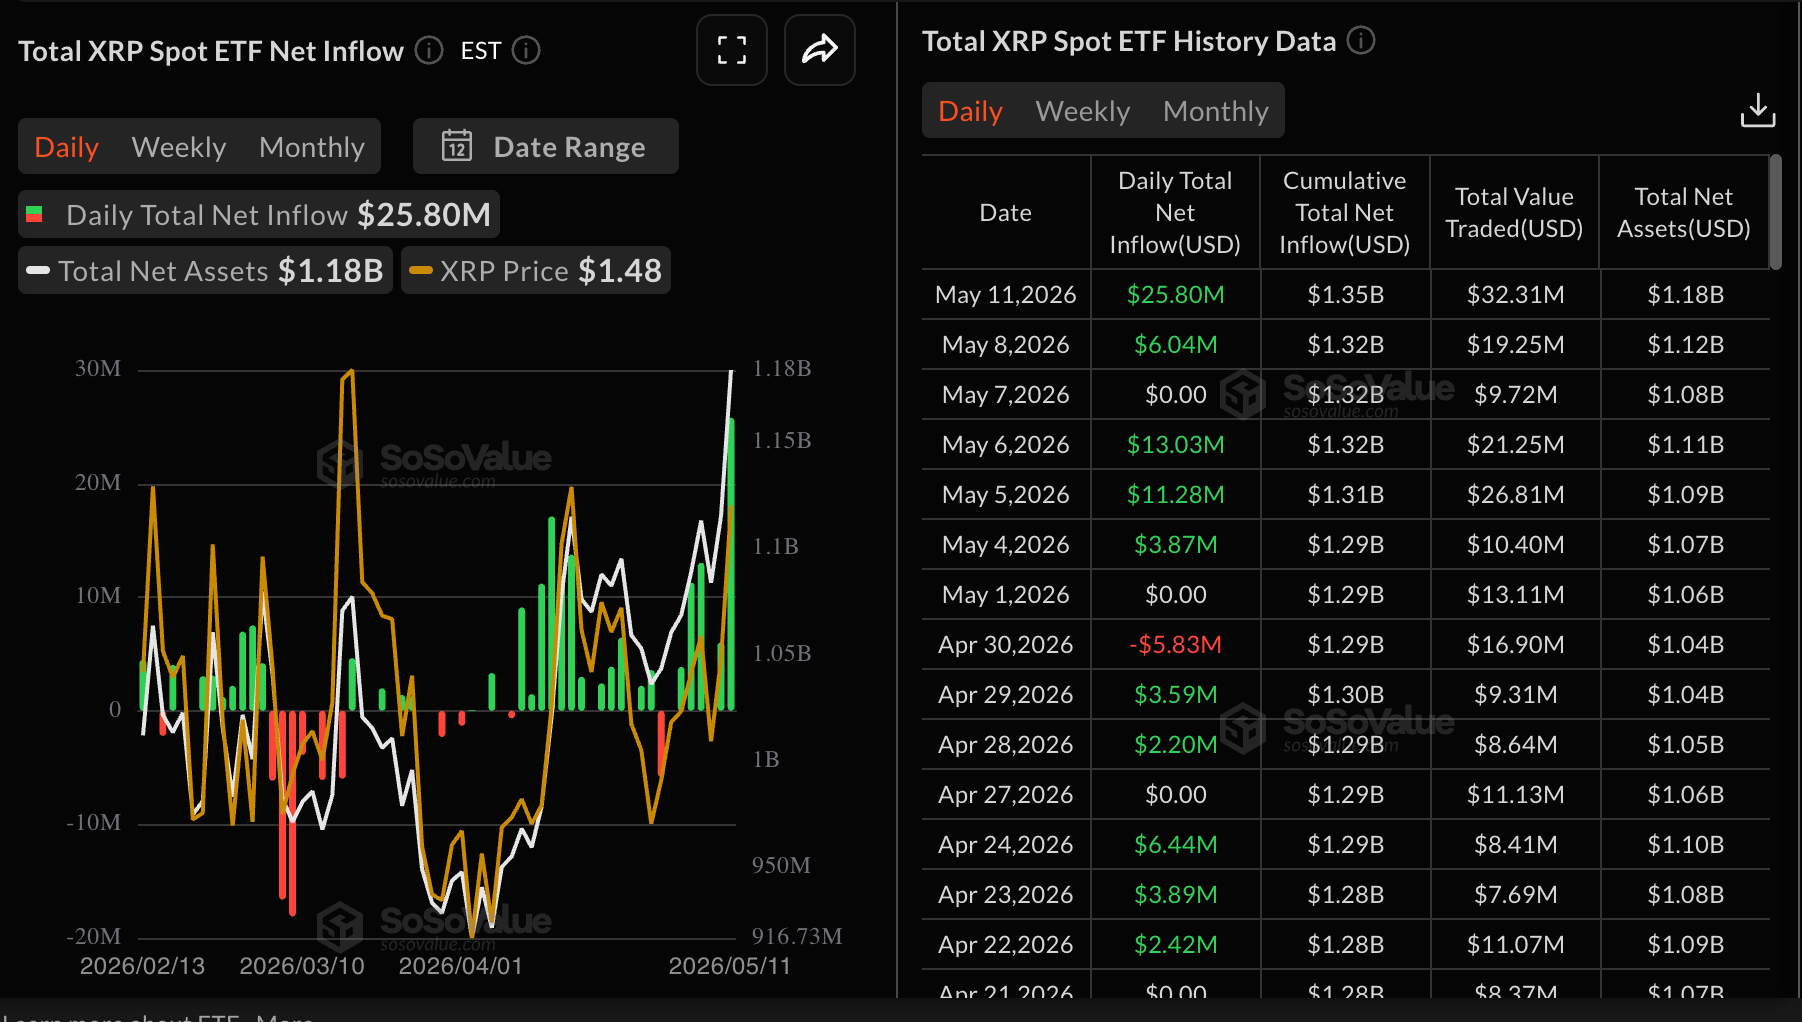
Institutional interest in XRP digital investment products showed significant growth with inflows totaling $26 million on Monday, up from approximately $6 million on Friday. Cumulative inflows now stand at $1.35 billion, with net assets averaging $1.18 billion.
Technical outlook: Bitcoin stays pressured as technicals weaken
Bitcoin trades at $80,871, retaining a constructive bullish bias as price holds well above the 50-day and 100-day Exponential Moving Averages (EMAs) at $76,242 and $76,669, respectively. The pair, however, is still trading just under the 200-period EMA at about $81,826, which acts as a nearby cap.
A mildly positive Moving Average Convergence Divergence (MACD) histogram and a Relative Strength Index (RSI) around 61 on the daily chart hint that upside momentum is present but not yet impulsive.
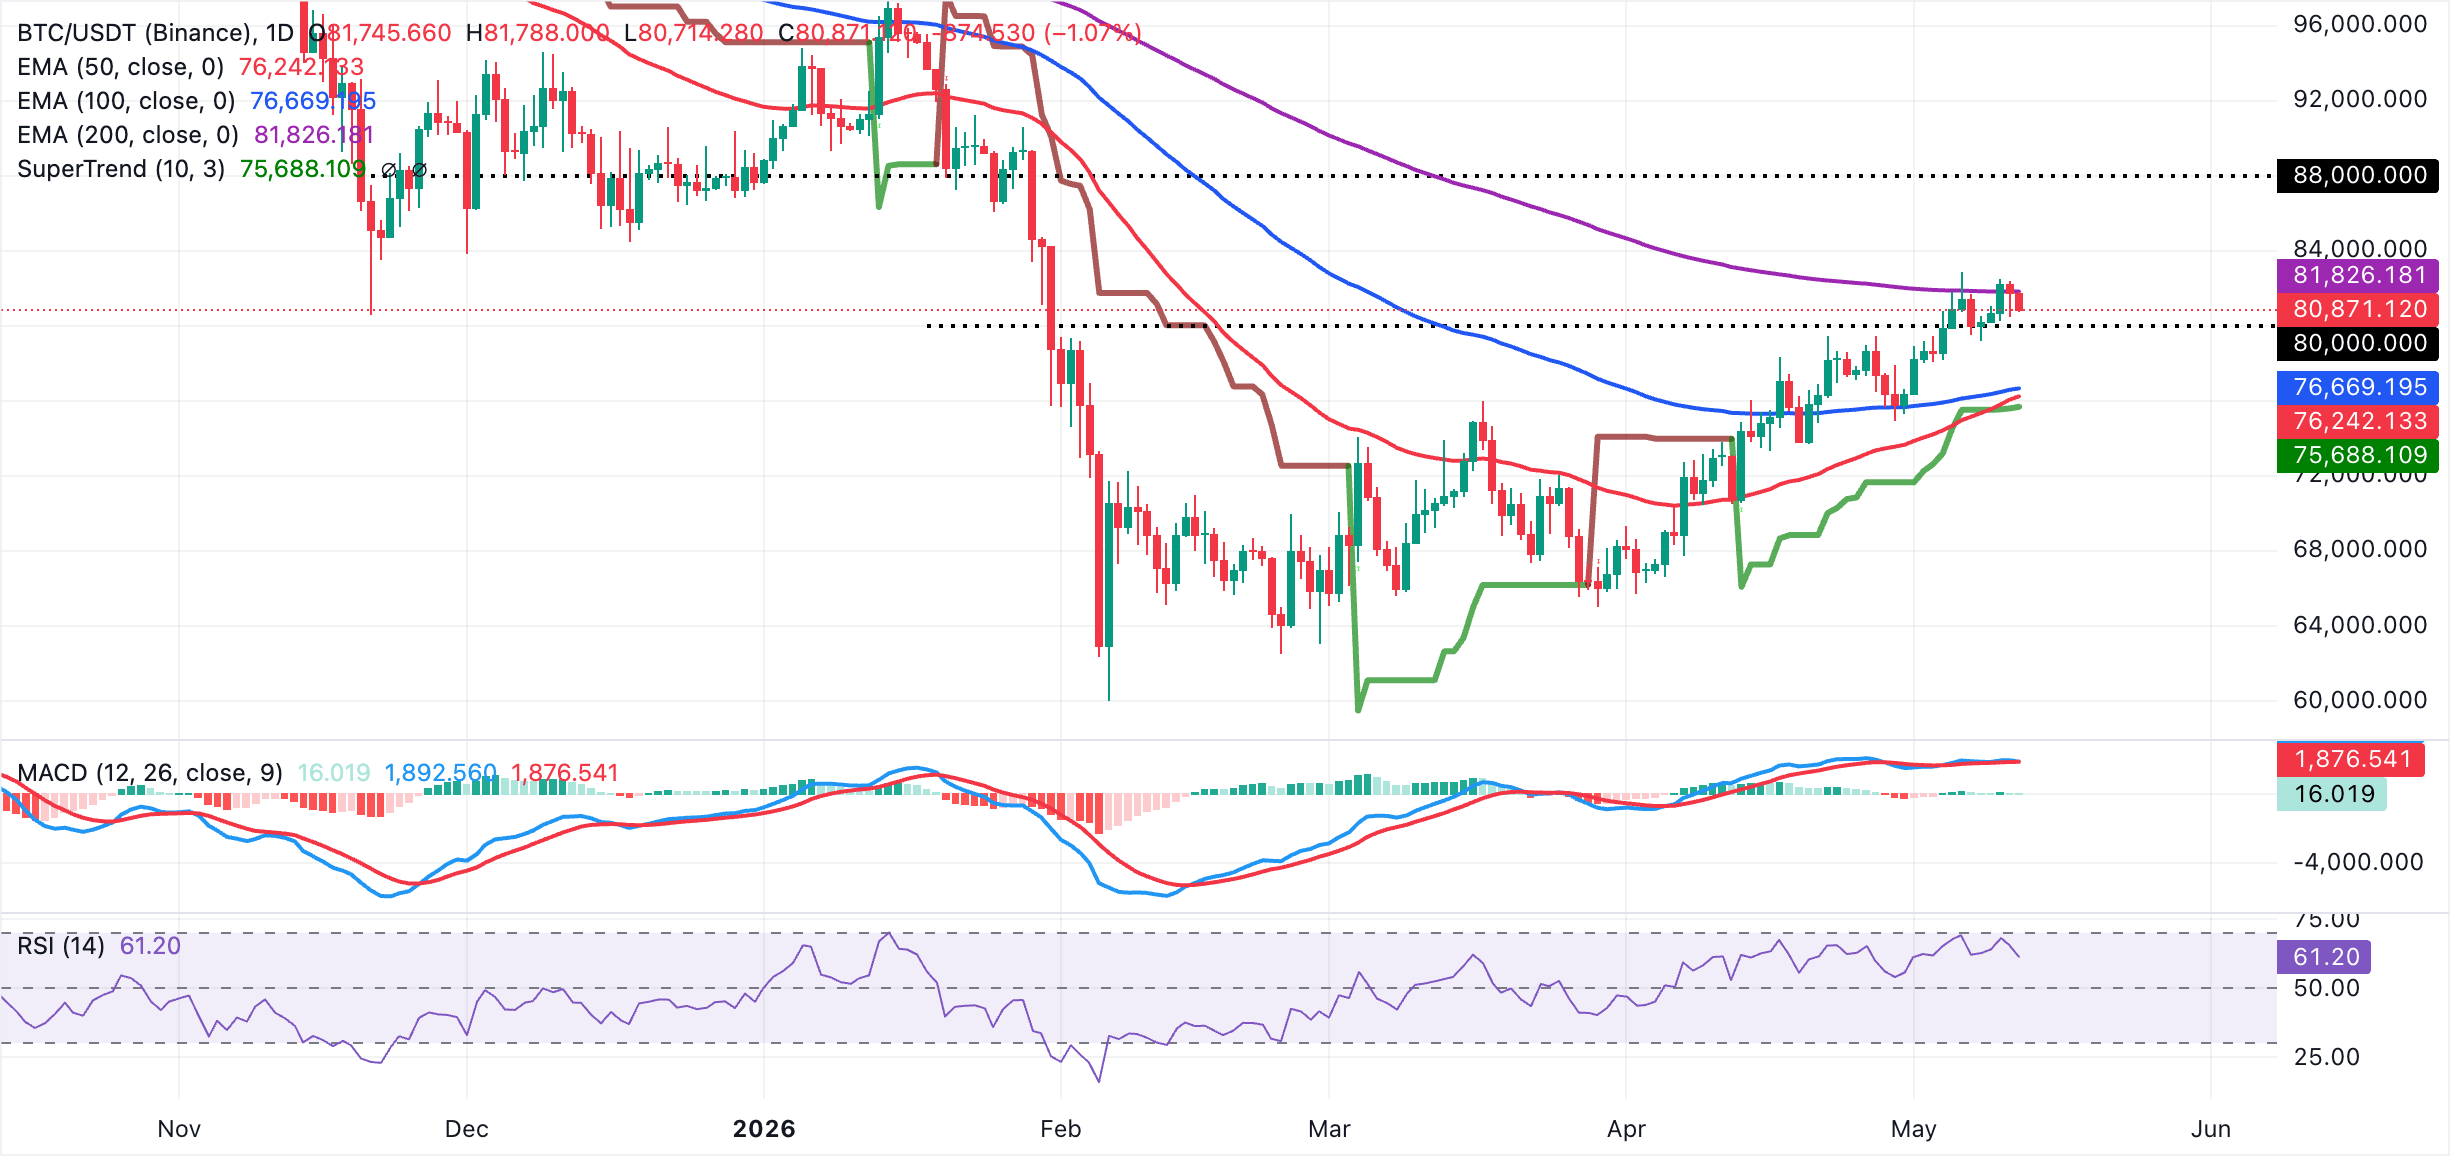
On the topside, immediate resistance is defined by the 200-period EMA at $81,826. A daily close above this barrier would open the way for a continuation of the uptrend. On the downside, initial support sits slightly below the current price area at $80,000, with deeper demand at the 100-day EMA near $76,669 and the 50-day EMA around $76,242. The SuperTrend line is at $75,688, where buyers are likely to defend the broader bullish structure.
Altcoins technical outlook: Ethereum and XRP falter as selling pressure builds
Ethereum trades at $2,291, holding just above the 50-day EMA at around $2,276 but still below the 100-day EMA near $2,341, which keeps the broader tone capped. The SuperTrend support zone clustered around $2,145 underpins the recent advance, while a neutral RSI near 49 and a negative MACD histogram suggest only modest downside pressure rather than a clear directional push.
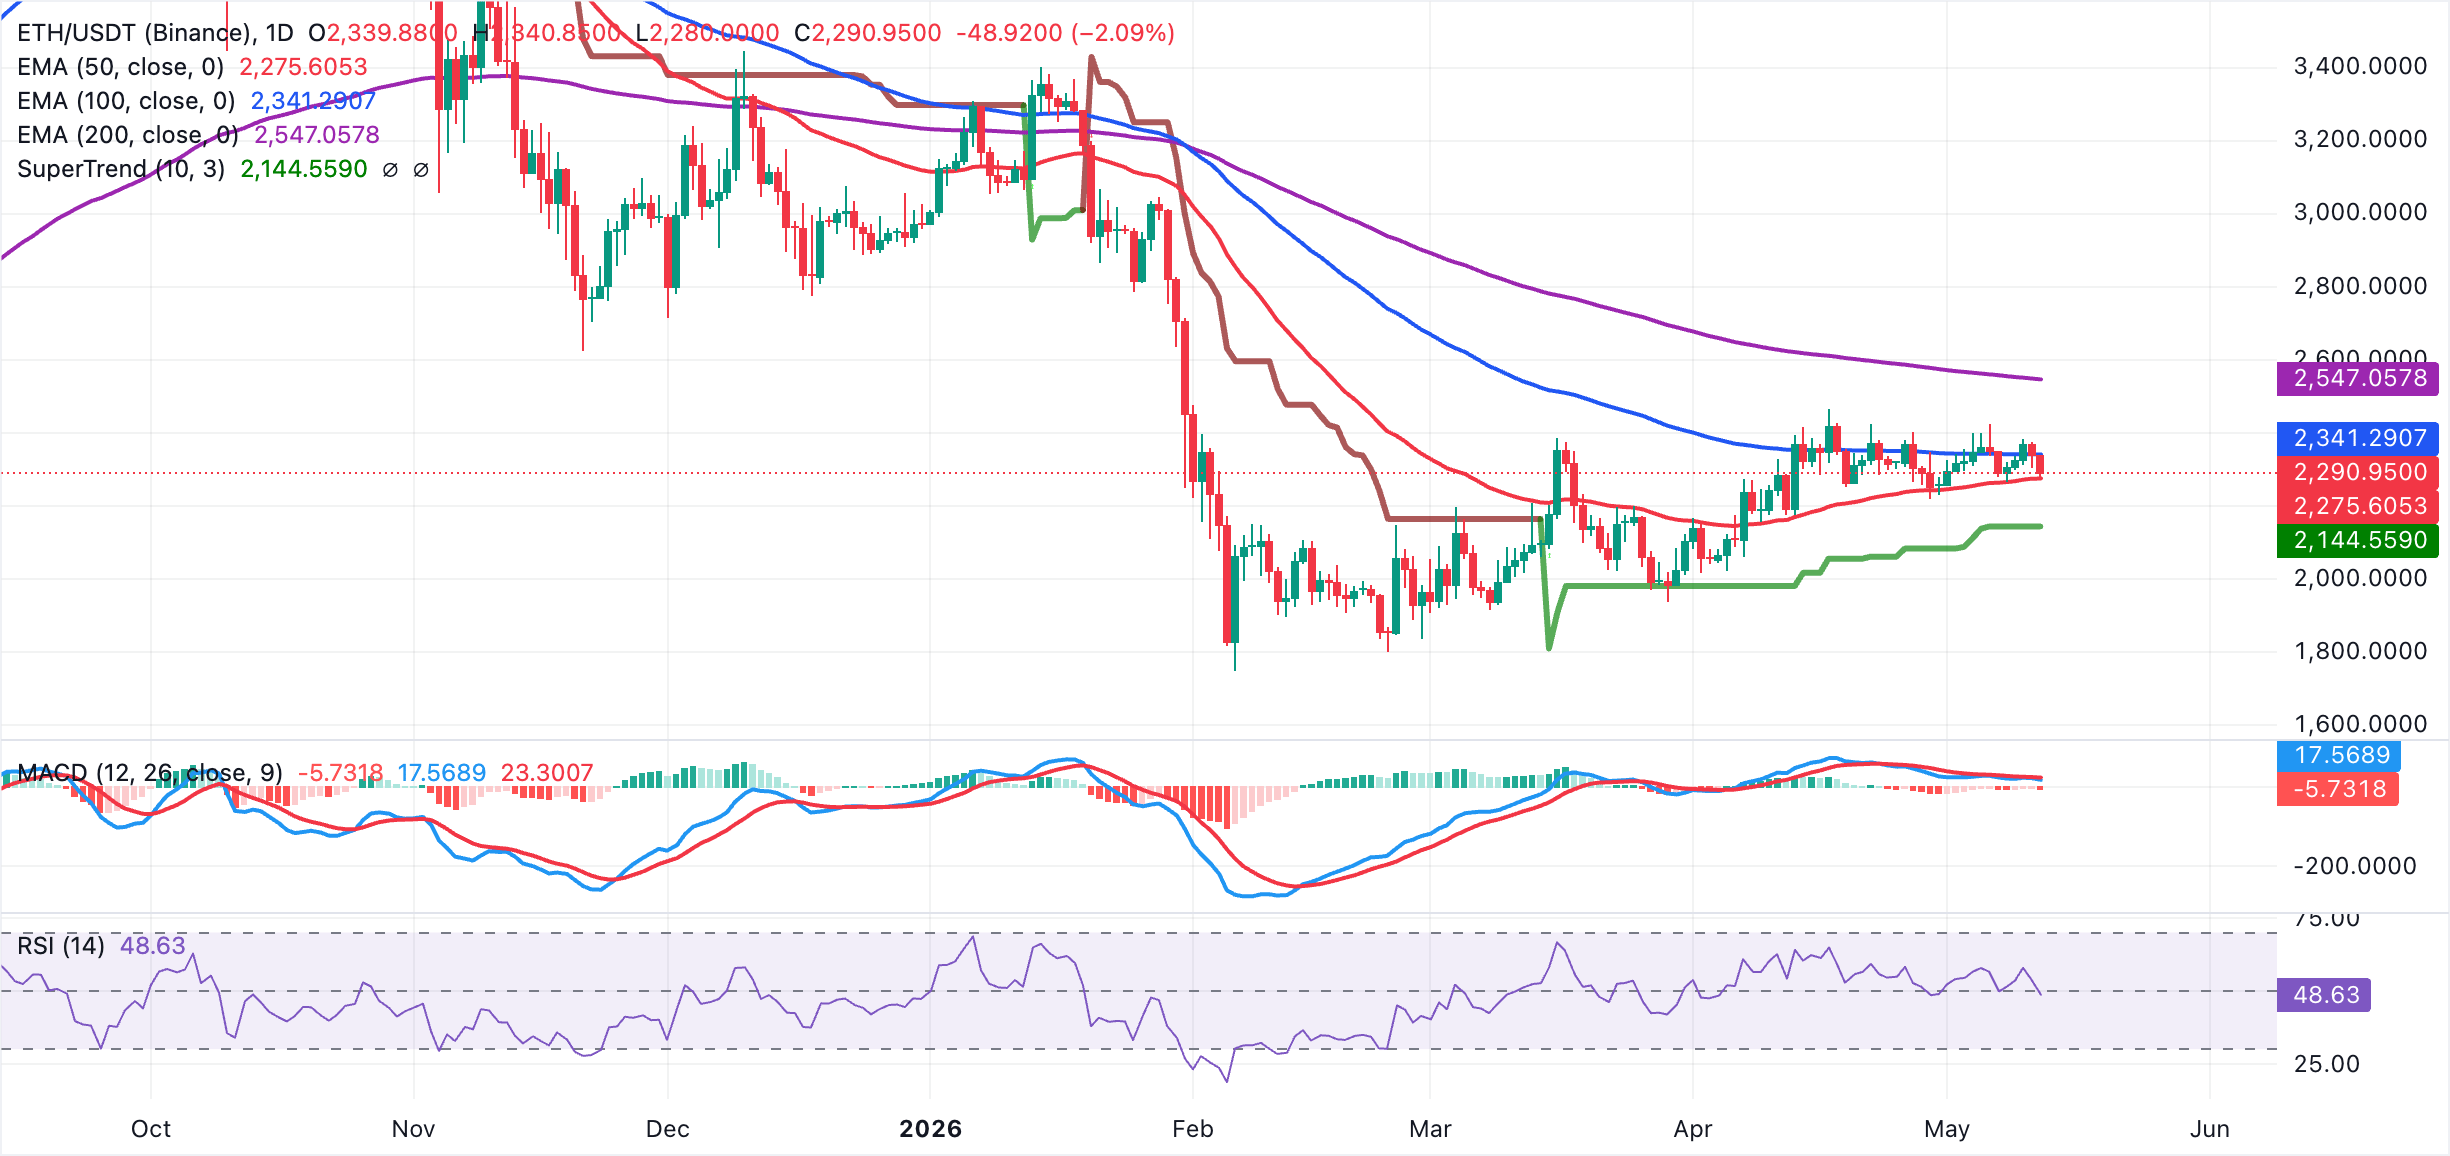
On the topside, initial resistance emerges at the 100-day EMA around $2,341, with the longer-term 200-day EMA higher up near $2,547 forming a more substantial barrier if buyers regain control. On the downside, immediate support lies at the 50-day EMA near $2,276, ahead of the SuperTrend line near $2,145, where a break would likely expose ETH to a deeper corrective phase.
XRP, on the other hand, trades near $1.47, maintaining a neutral-to-bullish tone as price remains above the 50-day EMA at $1.42 and the latest SuperTrend support near $1.34, yet still capped beneath the 100-day EMA at $1.50. The positive MACD histogram with a modestly rising profile, together with an RSI around 61 on the daily chart, suggests improving upside momentum, but the pair needs to clear nearby overhead averages to fully reassert a sustained uptrend.
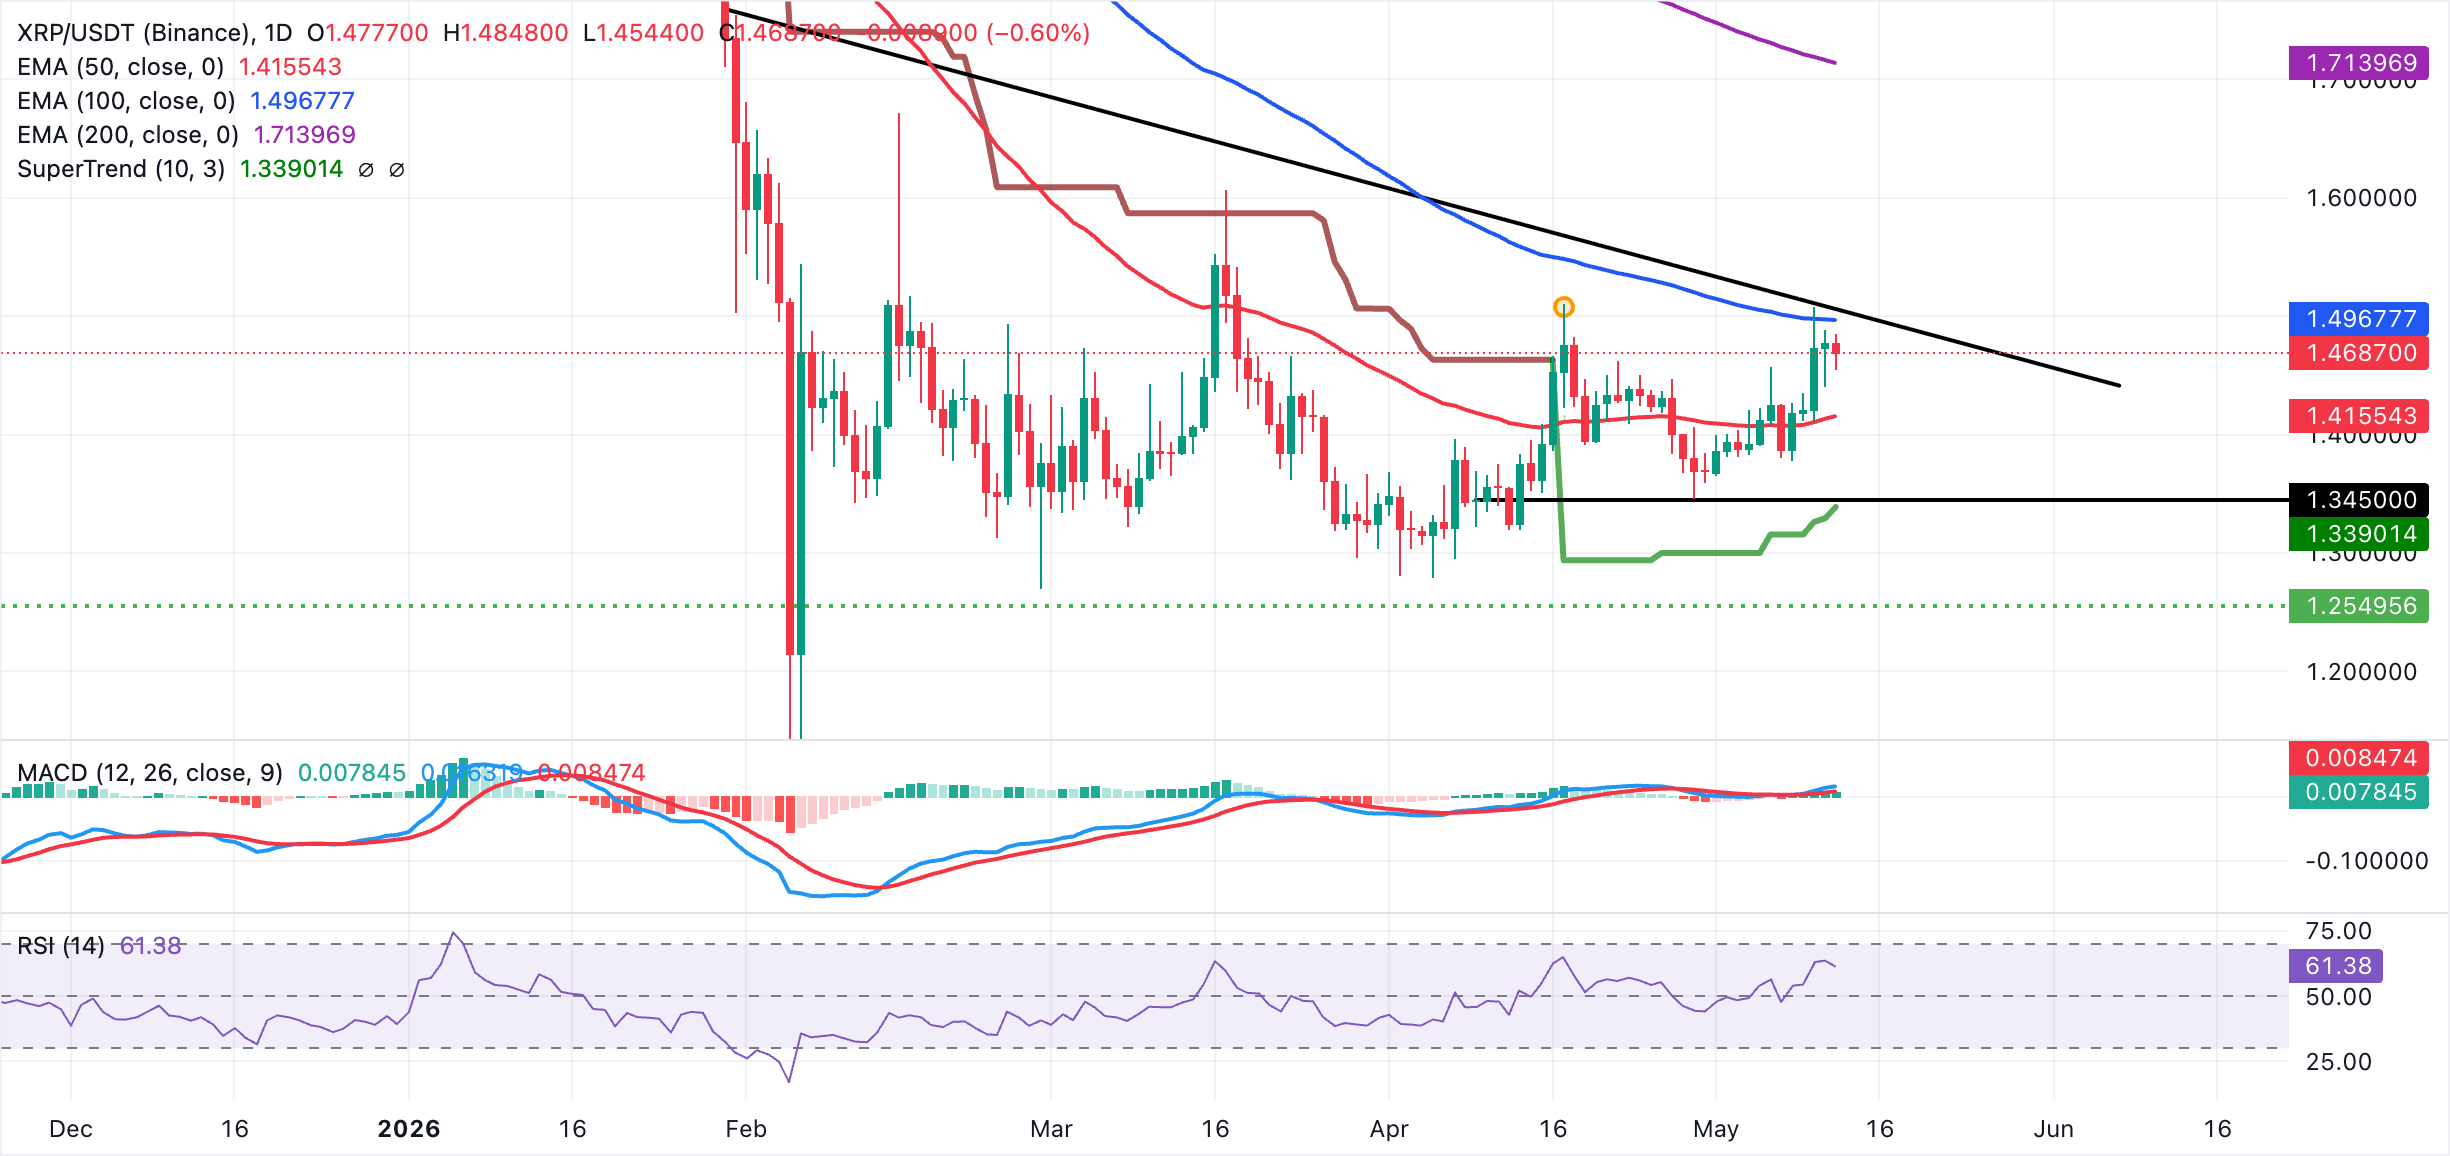
On the topside, initial resistance is seen at the 100-day EMA clustered around $1.50, followed by the downtrend resistance break level near $1.51, while the 200-day EMA, much higher at $1.71, marks a broader bullish trigger if reclaimed. On the downside, immediate support is anchored at the $1.45 pivotal level, with the 50-day EMA at $1.42 as the next line of demand, before the SuperTrend baseline at $1.34 serves as a deeper corrective floor.
(The technical analysis of this story was written with the help of an AI tool.)
Bitcoin, altcoins, stablecoins FAQs
Bitcoin is the largest cryptocurrency by market capitalization, a virtual currency designed to serve as money. This form of payment cannot be controlled by any one person, group, or entity, which eliminates the need for third-party participation during financial transactions.
Altcoins are any cryptocurrency apart from Bitcoin, but some also regard Ethereum as a non-altcoin because it is from these two cryptocurrencies that forking happens. If this is true, then Litecoin is the first altcoin, forked from the Bitcoin protocol and, therefore, an “improved” version of it.
Stablecoins are cryptocurrencies designed to have a stable price, with their value backed by a reserve of the asset it represents. To achieve this, the value of any one stablecoin is pegged to a commodity or financial instrument, such as the US Dollar (USD), with its supply regulated by an algorithm or demand. The main goal of stablecoins is to provide an on/off-ramp for investors willing to trade and invest in cryptocurrencies. Stablecoins also allow investors to store value since cryptocurrencies, in general, are subject to volatility.
Bitcoin dominance is the ratio of Bitcoin's market capitalization to the total market capitalization of all cryptocurrencies combined. It provides a clear picture of Bitcoin’s interest among investors. A high BTC dominance typically happens before and during a bull run, in which investors resort to investing in relatively stable and high market capitalization cryptocurrency like Bitcoin. A drop in BTC dominance usually means that investors are moving their capital and/or profits to altcoins in a quest for higher returns, which usually triggers an explosion of altcoin rallies.
Recommended Articles


