

USD/CHF Price Forecast: Bearish risks rise below 0.8000 as momentum indicators turn negative

Source Fxstreet
  • USD/CHF edges lower but downside remains limited amid US-Iran tensions and Oil-driven inflation risks.
  • Technically, USD/CHF is testing the 100-day SMA after failing to hold above 0.8000.
  • Momentum indicators weaken, with RSI below 50 and MACD turning negative.

USD/CHF edges lower on Monday but lacks follow-through selling as escalating US-Iran tensions and growing expectations that the Federal Reserve (Fed) will keep interest rates higher for longer, driven by rising Oil prices, help limit downside in the US Dollar (USD). At the same time, the Swiss Franc (CHF) struggles to attract strong demand as the Swiss National Bank’s readiness to act against excessive currency strength keeps investors cautious.

At the time of writing, USD/CHF is trading around 0.7876, down 0.13% on the day. Meanwhile, the US Dollar Index (DXY), which tracks the Greenback’s value against a basket of six major currencies, is hovering near 98.78 after opening the week with a gap higher toward the 99.00 level.

On the geopolitical front, US President Donald Trump has ordered a naval blockade targeting Iranian ports after US-Iran talks over the weekend concluded without a breakthrough, raising concerns about a prolonged conflict. Iran’s Islamic Revolutionary Guard Corps (IRGC) warned that any military vessels approaching the Strait of Hormuz would be seen as a ceasefire breach and could face a strong response.
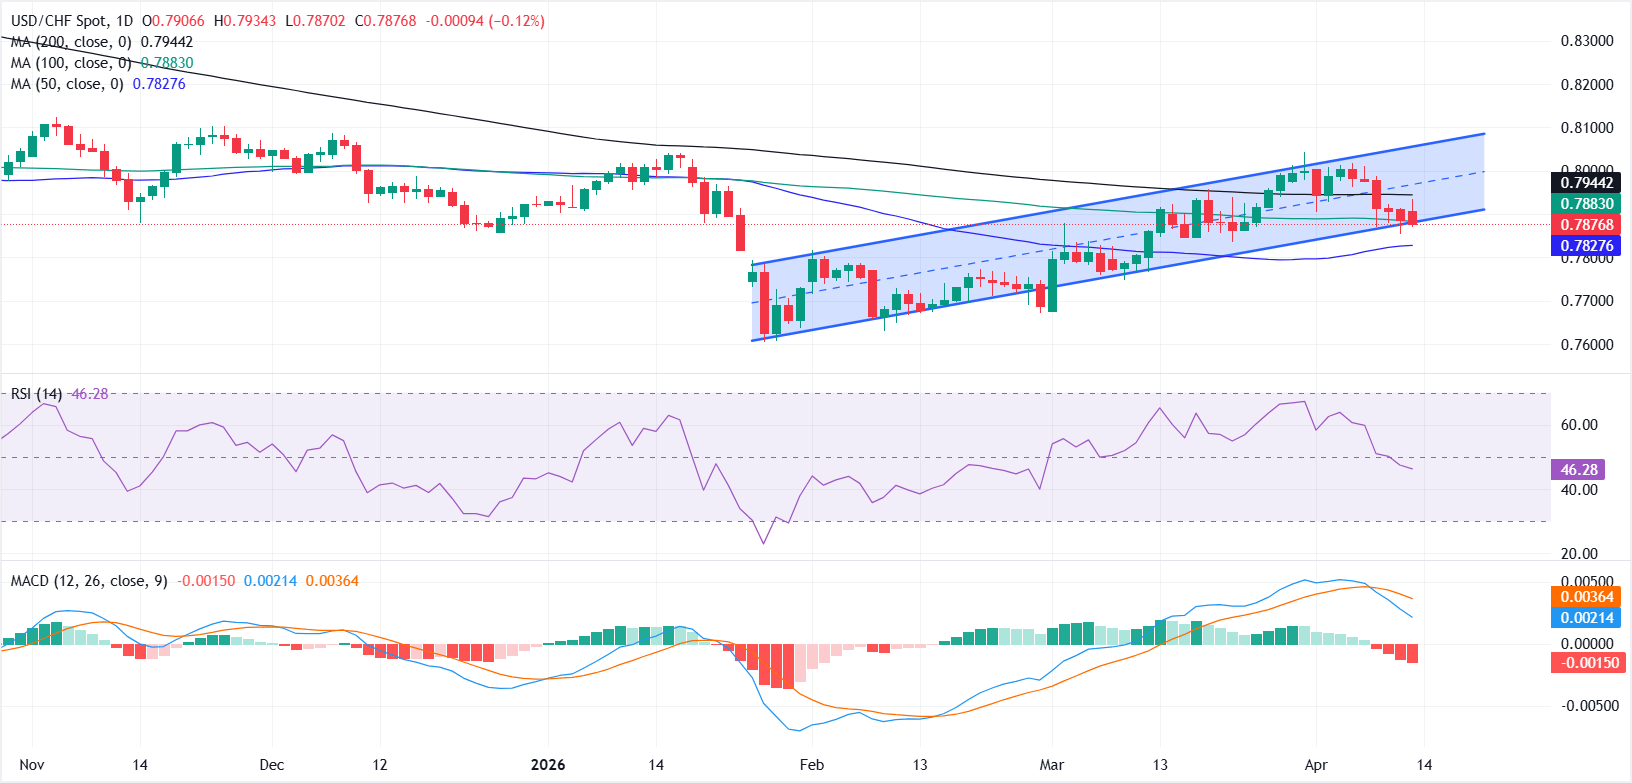
From a technical perspective, USD/CHF is trading within an upward-sloping parallel channel on the daily chart, with price now hovering near the lower boundary, which closely aligns with the 100-day Simple Moving Average (SMA) at 0.7883. This increases the risk of a breakdown after buyers failed to sustain gains above the 0.8000 psychological level.

A decisive break below the channel support or the 100-day SMA could expose the 50-day SMA at 0.7827 as the next support, followed by the March 10 low near 0.7748.

On the upside, the 200-day SMA at 0.7944 acts as immediate resistance, ahead of the upper boundary of the channel near the 0.8000 psychological mark. A sustained move above 0.8000 is needed to confirm renewed bullish momentum.

Momentum indicators suggest fading upside pressure. The Relative Strength Index (RSI) has slipped below the 50 mark, indicating weakening bullish momentum, while the Moving Average Convergence Divergence (MACD) is turning lower, with the histogram dipping into negative territory hinting that bearish momentum is beginning to build.

Swiss Franc Price Today

The table below shows the percentage change of Swiss Franc (CHF) against listed major currencies today. Swiss Franc was the strongest against the Japanese Yen.

USD EUR GBP JPY CAD AUD NZD CHF
USD 0.11% 0.04% 0.30% -0.20% 0.06% -0.07% -0.24%
EUR -0.11% -0.09% 0.17% -0.31% -0.07% -0.18% -0.31%
GBP -0.04% 0.09% 0.24% -0.25% 0.02% -0.10% -0.27%
JPY -0.30% -0.17% -0.24% -0.53% -0.27% -0.39% -0.49%
CAD 0.20% 0.31% 0.25% 0.53% 0.30% 0.15% -0.03%
AUD -0.06% 0.07% -0.02% 0.27% -0.30% -0.11% -0.22%
NZD 0.07% 0.18% 0.10% 0.39% -0.15% 0.11% -0.14%
CHF 0.24% 0.31% 0.27% 0.49% 0.03% 0.22% 0.14%

The heat map shows percentage changes of major currencies against each other. The base currency is picked from the left column, while the quote currency is picked from the top row. For example, if you pick the Swiss Franc from the left column and move along the horizontal line to the US Dollar, the percentage change displayed in the box will represent CHF (base)/USD (quote).

Disclaimer: For information purposes only. Past performance is not indicative of future results.
placeholder
Bitcoin squeezes back above $80,000 — 110,000 traders liquidated as the hawkish Fed and CLARITY setback fail to hold it down; is $83,000 next?Bitcoin closed above $80,000 on Friday for the first time since September 7, and pushed to $81,299 over the weekend, triggering about $603 million of liquidations — $523 million of them shorts — across more than 110,000 traders. With the Fed's hike already priced and the SEC and CFTC advancing crypto rules after the CLARITY Act failed, here is what stands between BTC and the $83,000 gate.
Author  Suzie
12 hours ago
Bitcoin closed above $80,000 on Friday for the first time since September 7, and pushed to $81,299 over the weekend, triggering about $603 million of liquidations — $523 million of them shorts — across more than 110,000 traders. With the Fed's hike already priced and the SEC and CFTC advancing crypto rules after the CLARITY Act failed, here is what stands between BTC and the $83,000 gate.
placeholder
Gold ends three-week slide at the $4,400 line — eight straight days of ETF inflows vs a 5% 10-year and a 100 dollarSpot gold closed Friday at $4,378.39, up 0.84% on the day and about 0.8% for the week — its first weekly gain in four weeks — with the intraday high of $4,399.67 leaving it 33 cents shy of the $4,400 line. Gold ETFs have now logged eight straight sessions of inflows, but with the 10-year back above 5% and the dollar index near 100, here is what decides whether this is a reversal or a bounce.
Author  Suzie
13 hours ago
Spot gold closed Friday at $4,378.39, up 0.84% on the day and about 0.8% for the week — its first weekly gain in four weeks — with the intraday high of $4,399.67 leaving it 33 cents shy of the $4,400 line. Gold ETFs have now logged eight straight sessions of inflows, but with the 10-year back above 5% and the dollar index near 100, here is what decides whether this is a reversal or a bounce.
placeholder
Have Fed Rate Hike Headwinds Been Priced In? Gold Rebounds Strongly Toward $4,400, Poised for a New Rally As of the European session on September 18, gold prices (XAUUSD) extended Thursday's rebound, rising strongly in intraday trading to $4,399.75 today, just shy of the $4,400 psychological
Author  TradingKey
Sep 18, Fri
As of the European session on September 18, gold prices (XAUUSD) extended Thursday's rebound, rising strongly in intraday trading to $4,399.75 today, just shy of the $4,400 psychological
placeholder
US to delay new "overcapacity" tariffs on China — what the pause means for trade, inflation and the dollarWashington is expected to hold off announcing new tariffs over Chinese "overcapacity" until after the 24 September summit, according to Bloomberg. The postponed plan would have added 7.5% to Chinese goods, taking second-term US tariffs to around 20%. Here is what is on the table, and what a deal versus no deal would mean for the yuan, Hong Kong equities and the dollar.
Author  Mitrade
Sep 18, Fri
Washington is expected to hold off announcing new tariffs over Chinese "overcapacity" until after the 24 September summit, according to Bloomberg. The postponed plan would have added 7.5% to Chinese goods, taking second-term US tariffs to around 20%. Here is what is on the table, and what a deal versus no deal would mean for the yuan, Hong Kong equities and the dollar.
placeholder
Gold rebounds to near $4,350 on weaker US Dollar, falling oil pricesGold price (XAU/USD) rises to near $4,345 during the early Asian session on Friday. The precious metal rebounds from a six-week low amid falling oil prices and a weaker US Dollar (USD). Traders continue to assess the latest Federal Reserve (Fed) rate hike and policy cues.
Author  FXStreet
Sep 18, Fri
Gold price (XAU/USD) rises to near $4,345 during the early Asian session on Friday. The precious metal rebounds from a six-week low amid falling oil prices and a weaker US Dollar (USD). Traders continue to assess the latest Federal Reserve (Fed) rate hike and policy cues.
Related Instrument
goTop
quote