


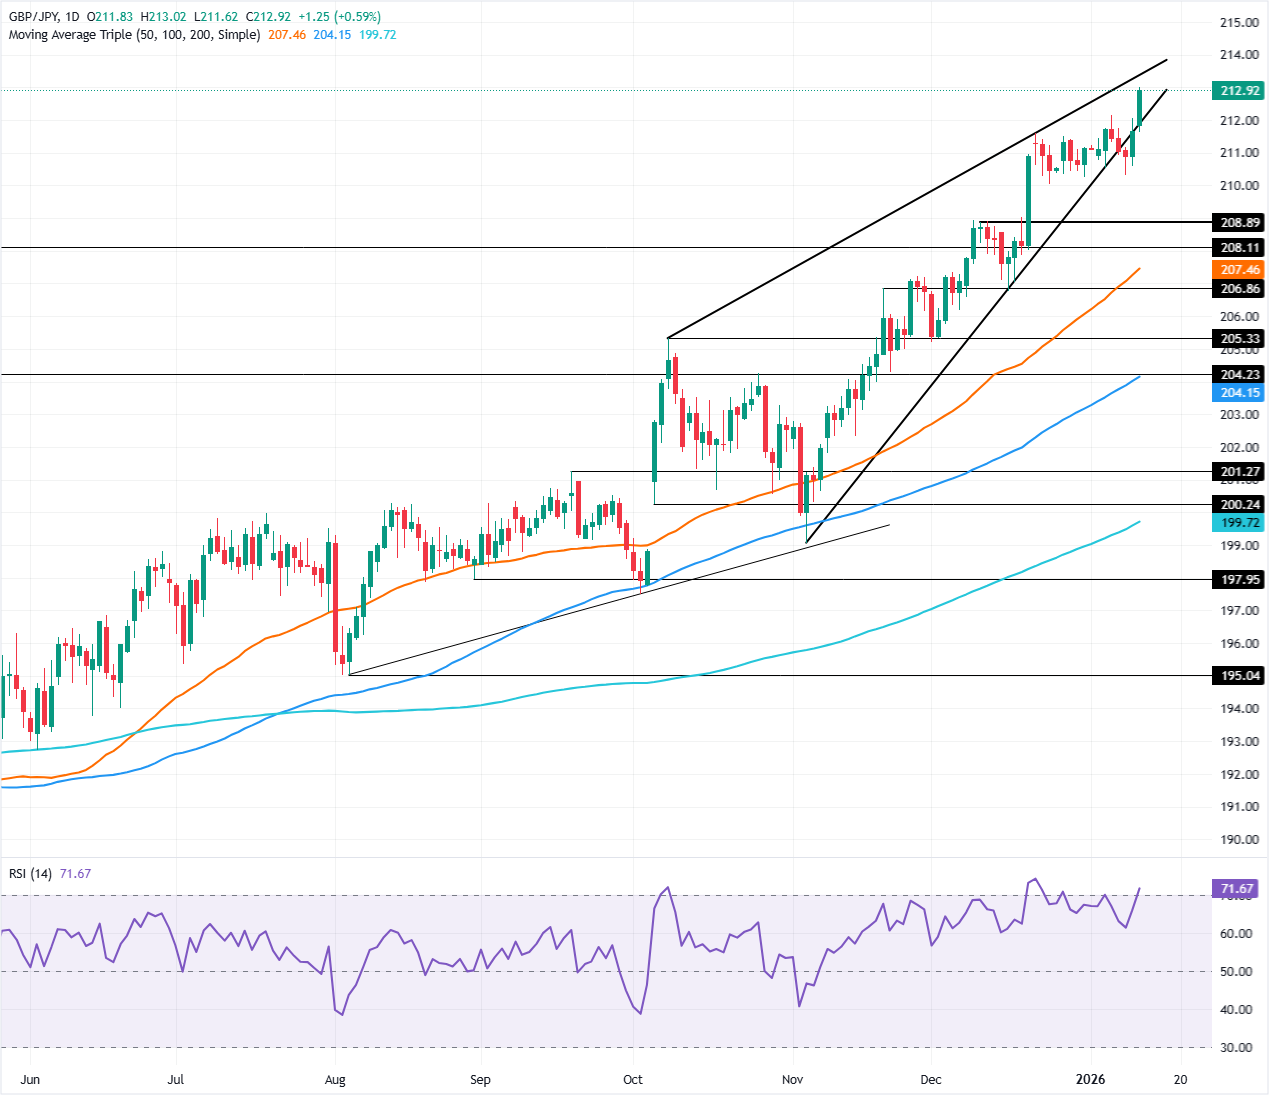
GBP/JPY Price Forecast: Breaks higher to 213.00 as risk-off sinks JPY
- GBP/JPY rallies above the 210.00–212.00 range as risk-off sentiment weakens the Yen.
- Bullish breakout targets 213.00 and 213.50, with momentum favoring further upside.
- Support rests at 212.00, then 211.00 and the 20-day SMA near 210.68.
The GBP/JPY rises on Monday, courtesy of a risk-off mood that weighed on safe-haven peers like the Japanese Yen and the Dollar, which are trading softer against most currencies. At the time of writing the cross-pair trade at 212.88 up 0.61%.
Japanese Yen Price This week
The table below shows the percentage change of Japanese Yen (JPY) against listed major currencies this week. Japanese Yen was the strongest against the Australian Dollar.
| USD | EUR | GBP | JPY | CAD | AUD | NZD | CHF | |
|---|---|---|---|---|---|---|---|---|
| USD | -0.03% | -0.02% | -0.06% | 0.00% | 0.06% | -0.08% | -0.05% | |
| EUR | 0.03% | 0.02% | -0.04% | 0.03% | 0.10% | -0.03% | -0.01% | |
| GBP | 0.02% | -0.02% | -0.02% | 0.02% | 0.08% | -0.07% | -0.01% | |
| JPY | 0.06% | 0.04% | 0.02% | 0.05% | 0.11% | -0.05% | 0.02% | |
| CAD | -0.01% | -0.03% | -0.02% | -0.05% | 0.06% | -0.09% | -0.02% | |
| AUD | -0.06% | -0.10% | -0.08% | -0.11% | -0.06% | -0.14% | -0.09% | |
| NZD | 0.08% | 0.03% | 0.07% | 0.05% | 0.09% | 0.14% | 0.06% | |
| CHF | 0.05% | 0.01% | 0.00% | -0.02% | 0.02% | 0.09% | -0.06% |
The heat map shows percentage changes of major currencies against each other. The base currency is picked from the left column, while the quote currency is picked from the top row. For example, if you pick the Japanese Yen from the left column and move along the horizontal line to the US Dollar, the percentage change displayed in the box will represent JPY (base)/USD (quote).
GBP/JPY Price Forecast: Technical outlook
The GBP/JPY technical picture is bullish after the pair cleared the top of the 210.00-212.00 trading range, pushing the pair to new yearly highs of 212.93, with buyers eyeing the 213.00 mark. Once surpassed, the next stop would be 213.50 mark, ahead of 214.00.
On the flip side, the GBP/JPY first support would be the 212.00 figure. A breach of the latter would clear the way to challenge 211.00, followed by the 20-day Simple Moving Average (SMA) at 210.68. Once surpassed, the next stop would be the 50-day SMA at 207.36.
GBP/JPY Price Chart – Daily
Japanese Yen FAQs
The Japanese Yen (JPY) is one of the world’s most traded currencies. Its value is broadly determined by the performance of the Japanese economy, but more specifically by the Bank of Japan’s policy, the differential between Japanese and US bond yields, or risk sentiment among traders, among other factors.
One of the Bank of Japan’s mandates is currency control, so its moves are key for the Yen. The BoJ has directly intervened in currency markets sometimes, generally to lower the value of the Yen, although it refrains from doing it often due to political concerns of its main trading partners. The BoJ ultra-loose monetary policy between 2013 and 2024 caused the Yen to depreciate against its main currency peers due to an increasing policy divergence between the Bank of Japan and other main central banks. More recently, the gradually unwinding of this ultra-loose policy has given some support to the Yen.
Over the last decade, the BoJ’s stance of sticking to ultra-loose monetary policy has led to a widening policy divergence with other central banks, particularly with the US Federal Reserve. This supported a widening of the differential between the 10-year US and Japanese bonds, which favored the US Dollar against the Japanese Yen. The BoJ decision in 2024 to gradually abandon the ultra-loose policy, coupled with interest-rate cuts in other major central banks, is narrowing this differential.
The Japanese Yen is often seen as a safe-haven investment. This means that in times of market stress, investors are more likely to put their money in the Japanese currency due to its supposed reliability and stability. Turbulent times are likely to strengthen the Yen’s value against other currencies seen as more risky to invest in.
Recommended Articles


