Japanese Yen edges lower ahead of BoJ meeting; bullish potential seems intact

Source Fxstreet
  • The Japanese Yen bulls opt to move to the sidelines ahead of the key BoJ meeting this week.
  • Bets for an imminent BoJ rate hike on Friday and a weaker risk tone should underpin the JPY.
  • Dovish Fed expectations might cap the attempted USD recovery move and the USD/JPY pair.

The Japanese Yen (JPY) edges lower during the Asian session on Wednesday as bulls turn cautious and opt to wait for the Bank of Japan (BoJ) policy update before placing fresh bets. Hence, the focus will remain glued to the outcome of a two-day BoJ meeting on Friday. Investors will look for cues about the central bank's policy path going into 2026, which will play a key role in determining the near-term trajectory for the JPY. Heading into the key central bank event, the growing acceptance of an imminent BoJ rate hike this week might continue to act as a tailwind for the JPY.

Apart from this, the prevalent risk-off environment – as depicted by a generally weaker tone around the equity markets – should contribute to limiting losses for the safe-haven JPY. The US Dollar (USD), on the other hand, struggles to capitalize on the previous day's modest recovery from its lowest level since early October amid bets for more interest rate cuts by the US Federal Reserve (Fed). This marks a significant divergence in comparison to hawkish BoJ expectations, which should benefit the lower-yielding JPY and back the case for a further depreciation for the USD/JPY pair.

Japanese Yen might continue to draw support from hawkish BoJ expectations and a softer risk tone

  • The Japanese Yen attracts some sellers during the Asian session on Wednesday amid some repositioning ahead of the highly-anticipated two-day Bank of Japan policy meeting, starting on Thursday. The central bank is widely expected to raise interest rates on Friday, and the bets were reaffirmed by the recent shift in rhetoric from BoJ Governor Kazuo Ueda.
  • Ueda reiterated last week that the likelihood of the central bank's baseline economic and price outlook materializing had been gradually increasing. The BoJ is getting closer to attaining its inflation target, Ueda added. This offsets concerns about Japan's deteriorating fiscal condition, amid Prime Minister Sanae Takaichi's massive spending plan, and should underpin the JPY.
  • The global risk sentiment remains on the defensive amid renewed worries about the health of China's economy and fears of the AI bubble burst. Moreover, the mixed US Nonfarm Payrolls report released on Tuesday fueled concerns about deteriorating labor market conditions in the world's largest economy and also tempered investors' appetite for perceived riskier assets.
  • The US Bureau of Labor Statistics (BLS) reported that the economy added 64K jobs in November against consensus estimates for an increase of 50K. In contrast, October payrolls declined by 105K, while September job gains were revised down to 108K from the initial estimate of 119K. Adding to this, the Unemployment Rate climbed to 4.6% from 4.4% in the previous month.
  • The data reaffirmed bets for further policy easing by the US Federal Reserve. In fact, traders are pricing in the possibility of two more interest rate cuts by the US central bank in 2026. This, in turn, keeps a lid on the overnight US Dollar recovery from a two-and-a-half-month low and suggests that the path of least resistance for the USD/JPY pair remains to the downside.
  • Traders now look forward to speeches from influential FOMC members for more cues about the Fed's rate-cut path, though the market attention will be on the latest US consumer inflation figures on Thursday. Apart from this, the outcome of a two-day BoJ policy meeting on Friday will play a key role in determining the next leg of a directional move for the USD/JPY pair.

USD/JPY seems vulnerable to retest the monthly swing low, around the 154.35-154.30 region

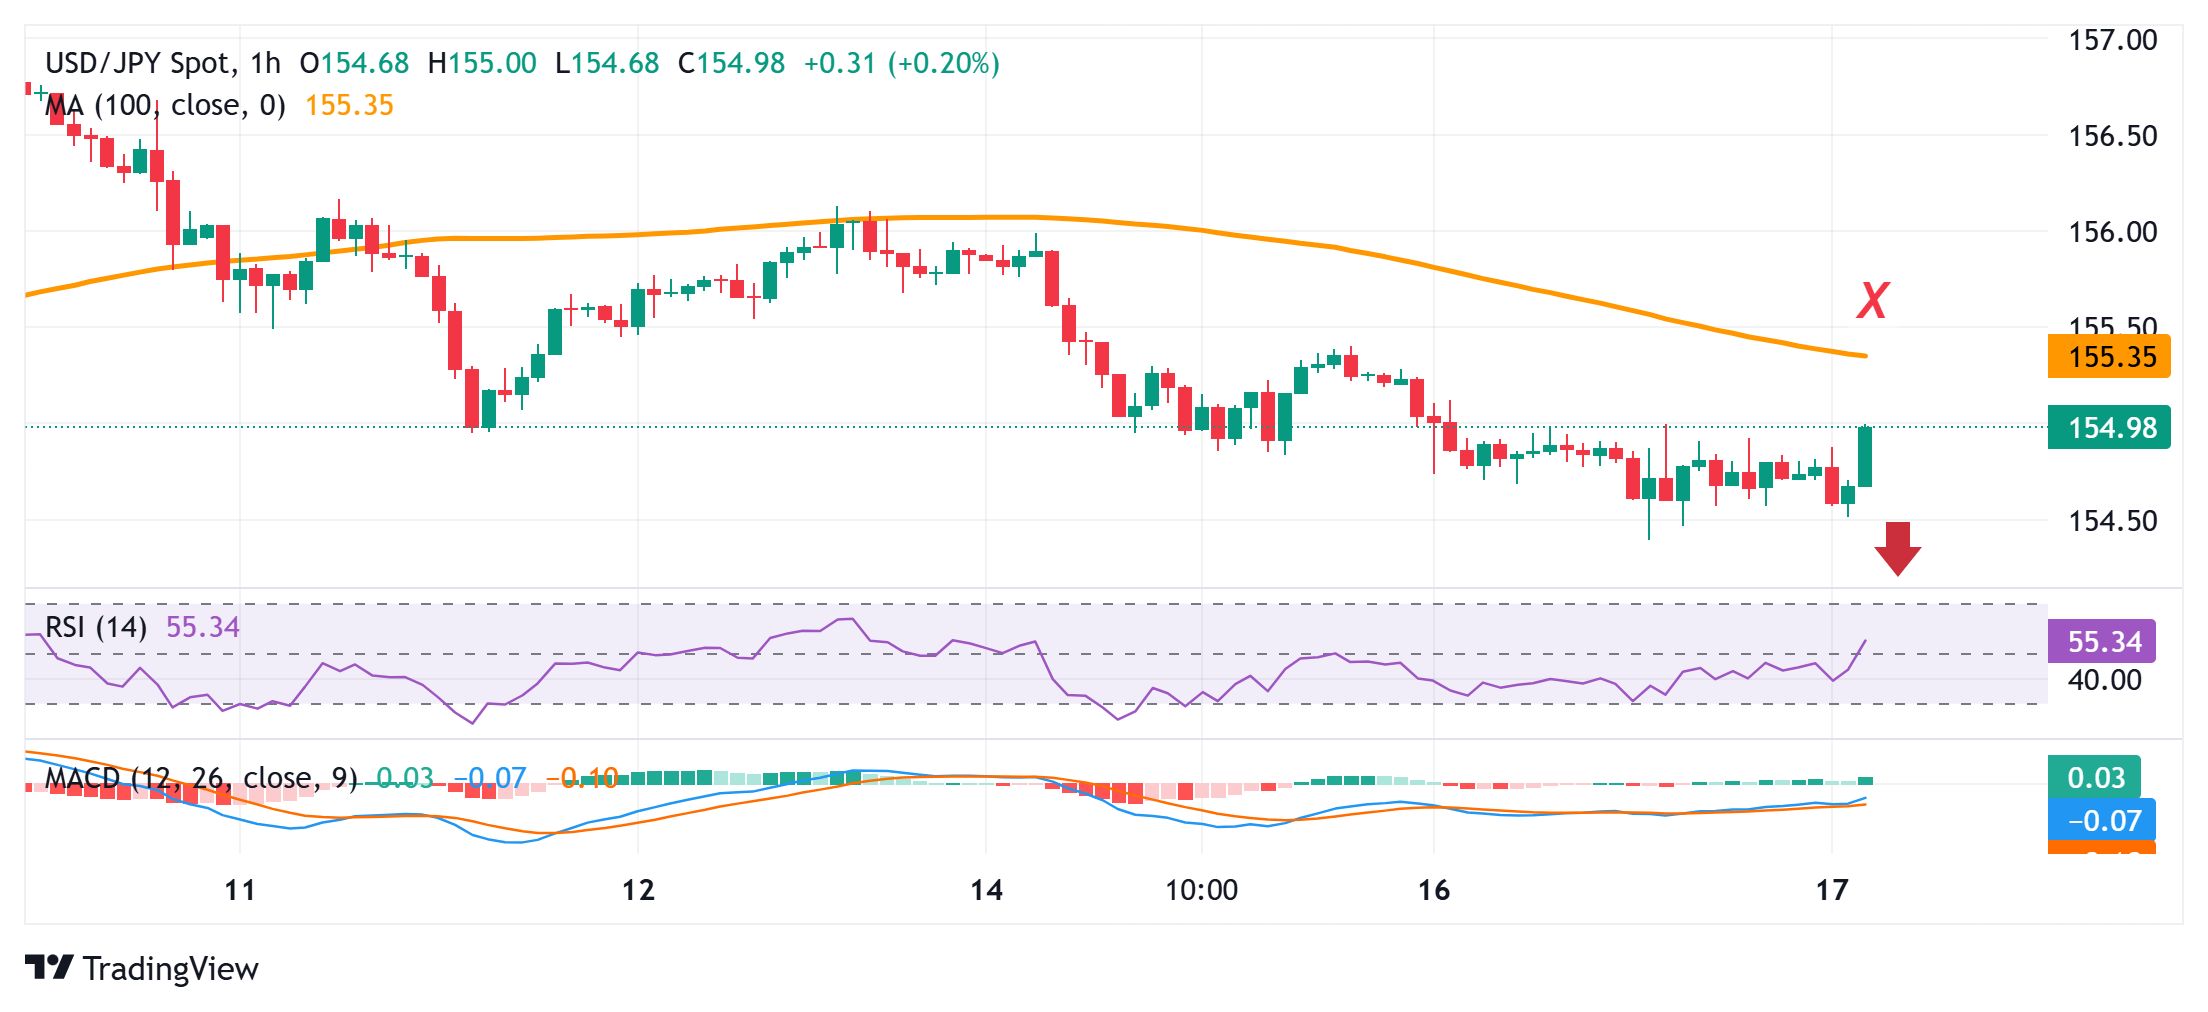
Against the backdrop of the USD/JPY pair's recent decline witnessed over the past week or so, the range-bound price action might still be categorized as a bearish consolidation phase. Moreover, oscillators on the daily chart have just started gaining negative traction, validating the near-term negative outlook for spot prices. Hence, weakness back towards retesting the monthly low, around the 154.35-154.30 region, en route to the 154.00 mark, looks like a distinct possibility. A convincing break below the latter will mark a fresh breakdown and pave the way for deeper losses.

On the flip side, the overnight swing high, around the 155.20-155.25 region, nearing the 100-hour Simple Moving Average (SMA), now seems to act as an immediate hurdle. A sustained strength beyond could trigger a bout of a short-covering rally and allow the USD/JPY pair to reclaim the 156.00 mark. The momentum could extend further towards the monthly swing high, around the 157.00 neighborhood, touched last week.

Japanese Yen FAQs

The Japanese Yen (JPY) is one of the world’s most traded currencies. Its value is broadly determined by the performance of the Japanese economy, but more specifically by the Bank of Japan’s policy, the differential between Japanese and US bond yields, or risk sentiment among traders, among other factors.

One of the Bank of Japan’s mandates is currency control, so its moves are key for the Yen. The BoJ has directly intervened in currency markets sometimes, generally to lower the value of the Yen, although it refrains from doing it often due to political concerns of its main trading partners. The BoJ ultra-loose monetary policy between 2013 and 2024 caused the Yen to depreciate against its main currency peers due to an increasing policy divergence between the Bank of Japan and other main central banks. More recently, the gradually unwinding of this ultra-loose policy has given some support to the Yen.

Over the last decade, the BoJ’s stance of sticking to ultra-loose monetary policy has led to a widening policy divergence with other central banks, particularly with the US Federal Reserve. This supported a widening of the differential between the 10-year US and Japanese bonds, which favored the US Dollar against the Japanese Yen. The BoJ decision in 2024 to gradually abandon the ultra-loose policy, coupled with interest-rate cuts in other major central banks, is narrowing this differential.

The Japanese Yen is often seen as a safe-haven investment. This means that in times of market stress, investors are more likely to put their money in the Japanese currency due to its supposed reliability and stability. Turbulent times are likely to strengthen the Yen’s value against other currencies seen as more risky to invest in.

Disclaimer: For information purposes only. Past performance is not indicative of future results.
placeholder
Gold Price Forecast: XAU/USD drifts higher above $4,200 as Fed delivers expected cutGold price (XAU/USD) gains momentum to around $4,235 during the early Asian session on Thursday. The precious metal extends its upside after the US Federal Reserve (Fed) delivered an expected third consecutive interest rate cut and maintained its outlook for just one cut in 2026.
Author  FXStreet
Dec 11, Thu
Gold price (XAU/USD) gains momentum to around $4,235 during the early Asian session on Thursday. The precious metal extends its upside after the US Federal Reserve (Fed) delivered an expected third consecutive interest rate cut and maintained its outlook for just one cut in 2026.
placeholder
Ethereum Price Slips Lower — $3,000 Looms as the Key BattlegroundEthereum is attempting to recover from a $3,026 low but remains below $3,200 and the 100-hour SMA, with a bearish trend line near $3,175 capping rebounds as bulls need a clean break above $3,200 to target $3,250–$3,400, while a drop below $3,050 risks a retest of $3,000 and $2,940.
Author  Mitrade
Dec 15, Mon
Ethereum is attempting to recover from a $3,026 low but remains below $3,200 and the 100-hour SMA, with a bearish trend line near $3,175 capping rebounds as bulls need a clean break above $3,200 to target $3,250–$3,400, while a drop below $3,050 risks a retest of $3,000 and $2,940.
placeholder
Macro Analysts: Hawkish Japan Could Push Bitcoin Below $70KAnalysts predict Bitcoin may face further declines towards the $70,000 mark if the Bank of Japan raises interest rates as expected.
Author  Mitrade
Dec 15, Mon
Analysts predict Bitcoin may face further declines towards the $70,000 mark if the Bank of Japan raises interest rates as expected.
placeholder
Bitcoin Slides 5% as Sellers Lean In — Can BTC Reclaim $88,000?Bitcoin has dropped back below $88,000 after rolling over from $90,500, with price still trading under the 100-hour Simple Moving Average. The sell-off found a floor at $85,151, and BTC is now consolidating near that base, but rebounds are facing pressure from a bearish trend line around $89,000. Bulls need to retake $88,000–$89,000 to ease downside risk; failure to do so keeps $85,500–$85,000 and then $83,500 in play, with $80,000 as the deeper “line in the sand.” Bitcoin (BTC) is back in damage-control mode after a sharp pullback wiped out recent gains. The price failed to reclaim the $90,000–$90,500 band, rolled over, and slid through $88,500 before briefly dipping under $87,000. Buyers did show up around $85,000, but the rebound so far looks more like stabilization than a clear trend reversal. Bitcoin dips hard, finds a bid near $85,000(h3) BTC’s latest move lower began when it couldn’t build follow-through above $90,000 and $90,500. Once that upside stalled, sellers took control and pushed price down through $88,500. The slide accelerated enough to spike below $87,000, but the market didn’t free-fall. Bulls defended the $85,000 zone, printing a low at $85,151. Since then, Bitcoin has been consolidating below the 23.6% Fibonacci retracement of the drop from the $93,560 swing high to the $85,151 low — a clue that the bounce is still shallow and that sellers haven’t fully backed off yet. Structurally, BTC is still on the back foot: It’s trading below $88,000, and It remains below the 100-hour Simple Moving Average, keeping short-term trend pressure pointed downward. Resistance is layered, and $89,000 is the problem area(h3) If bulls try to turn this into a recovery, they’ll have to climb through multiple ceilings in quick succession. First, BTC faces resistance around $87,150, followed by a more meaningful barrier near $87,500. From there, the market’s attention snaps back to $88,000 — the level BTC just lost and now needs to reclaim. A close back above $88,000 would improve the tone, but it doesn’t solve the bigger issue: there’s a bearish trend line on the hourly BTC/USD chart (Kraken feed) with resistance near $89,000, which also lines up with the next technical hurdle. If BTC can push through $89,000 and hold, the rebound could extend toward $90,000, with follow-through targets at $91,000 and $91,500. But until price clears that $88,000–$89,000 zone, rallies are at risk of being sold rather than chased. If BTC fails to reclaim resistance, the downside path is clear(h3) The near-term bear case is simple: if Bitcoin can’t climb back above the $87,000 area and keep traction, sellers may attempt another leg lower. Support levels line up like this: Immediate support: $85,500 First major support: $85,000 Next support: $83,500 Then $82,500 in the near term Below that, the major “don’t break this” level is still $80,000. If BTC slips under $80,000, the risk of acceleration to the downside increases significantly — not because it’s magic, but because it’s the kind of psychological and structural level that tends to trigger forced de-risking. Indicators: momentum still leans bearish(h3) The intraday indicators aren’t offering much comfort yet: Hourly MACD is losing pace in the bearish zone. Hourly RSI remains below 50, suggesting sellers still have the upper hand on short timeframes. So while the $85,000 defense held for now, the market hasn’t flipped bullish — it’s just stopped bleeding.
Author  Mitrade
Yesterday 02: 56
Bitcoin has dropped back below $88,000 after rolling over from $90,500, with price still trading under the 100-hour Simple Moving Average. The sell-off found a floor at $85,151, and BTC is now consolidating near that base, but rebounds are facing pressure from a bearish trend line around $89,000. Bulls need to retake $88,000–$89,000 to ease downside risk; failure to do so keeps $85,500–$85,000 and then $83,500 in play, with $80,000 as the deeper “line in the sand.” Bitcoin (BTC) is back in damage-control mode after a sharp pullback wiped out recent gains. The price failed to reclaim the $90,000–$90,500 band, rolled over, and slid through $88,500 before briefly dipping under $87,000. Buyers did show up around $85,000, but the rebound so far looks more like stabilization than a clear trend reversal. Bitcoin dips hard, finds a bid near $85,000(h3) BTC’s latest move lower began when it couldn’t build follow-through above $90,000 and $90,500. Once that upside stalled, sellers took control and pushed price down through $88,500. The slide accelerated enough to spike below $87,000, but the market didn’t free-fall. Bulls defended the $85,000 zone, printing a low at $85,151. Since then, Bitcoin has been consolidating below the 23.6% Fibonacci retracement of the drop from the $93,560 swing high to the $85,151 low — a clue that the bounce is still shallow and that sellers haven’t fully backed off yet. Structurally, BTC is still on the back foot: It’s trading below $88,000, and It remains below the 100-hour Simple Moving Average, keeping short-term trend pressure pointed downward. Resistance is layered, and $89,000 is the problem area(h3) If bulls try to turn this into a recovery, they’ll have to climb through multiple ceilings in quick succession. First, BTC faces resistance around $87,150, followed by a more meaningful barrier near $87,500. From there, the market’s attention snaps back to $88,000 — the level BTC just lost and now needs to reclaim. A close back above $88,000 would improve the tone, but it doesn’t solve the bigger issue: there’s a bearish trend line on the hourly BTC/USD chart (Kraken feed) with resistance near $89,000, which also lines up with the next technical hurdle. If BTC can push through $89,000 and hold, the rebound could extend toward $90,000, with follow-through targets at $91,000 and $91,500. But until price clears that $88,000–$89,000 zone, rallies are at risk of being sold rather than chased. If BTC fails to reclaim resistance, the downside path is clear(h3) The near-term bear case is simple: if Bitcoin can’t climb back above the $87,000 area and keep traction, sellers may attempt another leg lower. Support levels line up like this: Immediate support: $85,500 First major support: $85,000 Next support: $83,500 Then $82,500 in the near term Below that, the major “don’t break this” level is still $80,000. If BTC slips under $80,000, the risk of acceleration to the downside increases significantly — not because it’s magic, but because it’s the kind of psychological and structural level that tends to trigger forced de-risking. Indicators: momentum still leans bearish(h3) The intraday indicators aren’t offering much comfort yet: Hourly MACD is losing pace in the bearish zone. Hourly RSI remains below 50, suggesting sellers still have the upper hand on short timeframes. So while the $85,000 defense held for now, the market hasn’t flipped bullish — it’s just stopped bleeding.
placeholder
Senate Delays Crypto Market Structure Hearings to Early 2026The Senate Banking Committee has postponed cryptocurrency market structure hearings until 2026, citing ongoing bipartisan negotiations.
Author  Mitrade
23 hours ago
The Senate Banking Committee has postponed cryptocurrency market structure hearings until 2026, citing ongoing bipartisan negotiations.
goTop
quote