Australian Dollar extends losses as USD stays firm amid fading Fed rate cut bets

Source Fxstreet
  • The Australian Dollar weakens even as markets grow increasingly wary of an RBA rate hike as early as February.
  • Commonwealth Bank of Australia and National Australia Bank expect earlier RBA tightening due to persistent inflation and capacity constraints.
  • The USD may find support as mixed labor data failed to bolster expectations for further Federal Reserve rate cuts.

The Australian Dollar (AUD) declines against the US Dollar (USD) on Wednesday, extending its losses for the fifth consecutive day. However, the downside of the AUD/USD pair could be restrained as the Aussie Dollar could find support as markets grow increasingly wary of a Reserve Bank of Australia (RBA) rate hike as early as February.

Commonwealth Bank of Australia and National Australia Bank now expect the RBA to start tightening sooner than previously projected, pointing to stubborn inflation in a capacity-constrained economy. Their forecasts followed the central bank’s hawkish hold on rates at its final 2025 meeting last week. Swaps price in a 28% chance of a February hike, nearly 41% in March, with August almost fully priced.

The AUD remains under pressure as Australia’s preliminary S&P Global Manufacturing PMI edged up to 52.2 in December from 51.6 previously, according to data released by S&P Global on Tuesday. Meanwhile, the Services PMI slipped to 51.0 from 52.8, and the Composite PMI fell to 51.1 from 52.6.

US Dollar struggles despite diminishing Fed rate cut bets

  • The US Dollar Index (DXY), which measures the value of the US Dollar against six major currencies, is holding ground and trading around 98.20 at the time of writing. The USD could find support as mixed labor market data did little to reinforce expectations of additional Federal Reserve rate cuts.
  • The US November jobs report showed payroll growth of 64K, slightly above forecasts, but October figures were revised sharply lower and the unemployment rate rose to 4.6%, the highest since 2021, underscoring a gradually cooling labor market. Retail sales were flat on the month, reinforcing signs that consumer demand is losing momentum.
  • Fed officials are split over whether more easing of monetary policy is needed next year. The median Fed official penciled in just one reduction in 2026, but some policymakers see no further cuts. Meanwhile, traders anticipate two rate cuts next year.
  • The CME FedWatch tool suggests that Fed funds futures are pricing an implied 74.4% chance of a hold in rates at the US central bank's next meeting in January, up from nearly 70% a week ago.
  • The National Bureau of Statistics (NBS) showed Monday that China’s Retail Sales rose 1.3% year-over-year (YoY) in November vs. 2.9% expected and 2.9% in October. Chinese Industrial Production increased 4.8% YoY in the same period, compared to the 5.0% forecast and 4.9% seen previously.
  • China’s Fixed Asset Investment came in at -2.6% year-to-date (YTD) YoY in November, missing the expected -2.3% figure. The October reading was -1.7%.
  • The Australian Bureau of Statistics (ABS) reported last week that the Unemployment Rate steadied at 4.3% in November. The figure came in below the market consensus of 4.4%. Furthermore, the Australian Employment Change arrived at -21.3K in November from 41.1K in October (revised from 42.2K), compared with the consensus forecast of 20K.

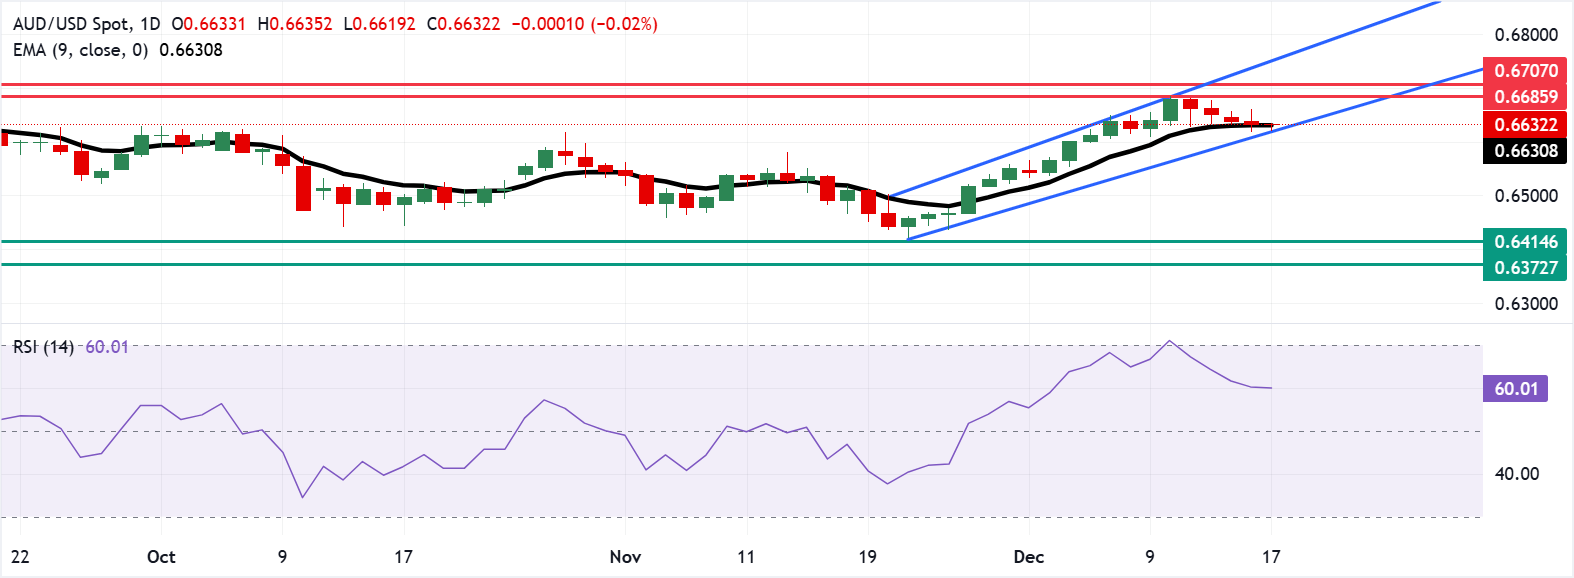
Australian Dollar hovers around nine-day EMA near lower ascending channel boundary

The AUD/USD pair is trading around 0.6630 on Wednesday. The technical analysis of the daily chart shows the pair trading within an ascending channel trend, reflecting a bullish bias. However, the pair is hovering around the nine-day Exponential Moving Average (EMA), indicating a neutral short-term price momentum.

The AUD/USD pair could test the lower boundary of the ascending channel around 0.6620. A break below the channel could put downward pressure on the pair to navigate the region around the six-month low of 0.6414, recorded on August 21.

On the upside, the AUD/USD pair may target the three-month high of 0.6685, followed by 0.6707, the highest since October 2024. Further advances would support the pair to test the upper ascending channel boundary around 0.6740.

AUD/USD: Daily Chart

Australian Dollar Price Today

The table below shows the percentage change of Australian Dollar (AUD) against listed major currencies today. Australian Dollar was the weakest against the Japanese Yen.

USD EUR GBP JPY CAD AUD NZD CHF
USD 0.00% 0.01% -0.03% 0.03% 0.00% -0.01% -0.01%
EUR -0.00% 0.01% -0.04% 0.03% 0.00% -0.01% -0.01%
GBP -0.01% -0.01% -0.04% 0.02% -0.01% -0.02% -0.03%
JPY 0.03% 0.04% 0.04% 0.07% 0.04% 0.02% 0.02%
CAD -0.03% -0.03% -0.02% -0.07% -0.03% -0.05% -0.05%
AUD -0.01% -0.00% 0.00% -0.04% 0.03% -0.01% -0.02%
NZD 0.01% 0.01% 0.02% -0.02% 0.05% 0.01% -0.01%
CHF 0.01% 0.01% 0.03% -0.02% 0.05% 0.02% 0.00%

The heat map shows percentage changes of major currencies against each other. The base currency is picked from the left column, while the quote currency is picked from the top row. For example, if you pick the Australian Dollar from the left column and move along the horizontal line to the US Dollar, the percentage change displayed in the box will represent AUD (base)/USD (quote).

Australian Dollar FAQs

One of the most significant factors for the Australian Dollar (AUD) is the level of interest rates set by the Reserve Bank of Australia (RBA). Because Australia is a resource-rich country another key driver is the price of its biggest export, Iron Ore. The health of the Chinese economy, its largest trading partner, is a factor, as well as inflation in Australia, its growth rate and Trade Balance. Market sentiment – whether investors are taking on more risky assets (risk-on) or seeking safe-havens (risk-off) – is also a factor, with risk-on positive for AUD.

The Reserve Bank of Australia (RBA) influences the Australian Dollar (AUD) by setting the level of interest rates that Australian banks can lend to each other. This influences the level of interest rates in the economy as a whole. The main goal of the RBA is to maintain a stable inflation rate of 2-3% by adjusting interest rates up or down. Relatively high interest rates compared to other major central banks support the AUD, and the opposite for relatively low. The RBA can also use quantitative easing and tightening to influence credit conditions, with the former AUD-negative and the latter AUD-positive.

China is Australia’s largest trading partner so the health of the Chinese economy is a major influence on the value of the Australian Dollar (AUD). When the Chinese economy is doing well it purchases more raw materials, goods and services from Australia, lifting demand for the AUD, and pushing up its value. The opposite is the case when the Chinese economy is not growing as fast as expected. Positive or negative surprises in Chinese growth data, therefore, often have a direct impact on the Australian Dollar and its pairs.

Iron Ore is Australia’s largest export, accounting for $118 billion a year according to data from 2021, with China as its primary destination. The price of Iron Ore, therefore, can be a driver of the Australian Dollar. Generally, if the price of Iron Ore rises, AUD also goes up, as aggregate demand for the currency increases. The opposite is the case if the price of Iron Ore falls. Higher Iron Ore prices also tend to result in a greater likelihood of a positive Trade Balance for Australia, which is also positive of the AUD.

The Trade Balance, which is the difference between what a country earns from its exports versus what it pays for its imports, is another factor that can influence the value of the Australian Dollar. If Australia produces highly sought after exports, then its currency will gain in value purely from the surplus demand created from foreign buyers seeking to purchase its exports versus what it spends to purchase imports. Therefore, a positive net Trade Balance strengthens the AUD, with the opposite effect if the Trade Balance is negative.

Disclaimer: For information purposes only. Past performance is not indicative of future results.
placeholder
Gold Price Forecast: XAU/USD drifts higher above $4,200 as Fed delivers expected cutGold price (XAU/USD) gains momentum to around $4,235 during the early Asian session on Thursday. The precious metal extends its upside after the US Federal Reserve (Fed) delivered an expected third consecutive interest rate cut and maintained its outlook for just one cut in 2026.
Author  FXStreet
Dec 11, Thu
Gold price (XAU/USD) gains momentum to around $4,235 during the early Asian session on Thursday. The precious metal extends its upside after the US Federal Reserve (Fed) delivered an expected third consecutive interest rate cut and maintained its outlook for just one cut in 2026.
placeholder
Ethereum Price Slips Lower — $3,000 Looms as the Key BattlegroundEthereum is attempting to recover from a $3,026 low but remains below $3,200 and the 100-hour SMA, with a bearish trend line near $3,175 capping rebounds as bulls need a clean break above $3,200 to target $3,250–$3,400, while a drop below $3,050 risks a retest of $3,000 and $2,940.
Author  Mitrade
Dec 15, Mon
Ethereum is attempting to recover from a $3,026 low but remains below $3,200 and the 100-hour SMA, with a bearish trend line near $3,175 capping rebounds as bulls need a clean break above $3,200 to target $3,250–$3,400, while a drop below $3,050 risks a retest of $3,000 and $2,940.
placeholder
Macro Analysts: Hawkish Japan Could Push Bitcoin Below $70KAnalysts predict Bitcoin may face further declines towards the $70,000 mark if the Bank of Japan raises interest rates as expected.
Author  Mitrade
Dec 15, Mon
Analysts predict Bitcoin may face further declines towards the $70,000 mark if the Bank of Japan raises interest rates as expected.
placeholder
Bitcoin Slides 5% as Sellers Lean In — Can BTC Reclaim $88,000?Bitcoin has dropped back below $88,000 after rolling over from $90,500, with price still trading under the 100-hour Simple Moving Average. The sell-off found a floor at $85,151, and BTC is now consolidating near that base, but rebounds are facing pressure from a bearish trend line around $89,000. Bulls need to retake $88,000–$89,000 to ease downside risk; failure to do so keeps $85,500–$85,000 and then $83,500 in play, with $80,000 as the deeper “line in the sand.” Bitcoin (BTC) is back in damage-control mode after a sharp pullback wiped out recent gains. The price failed to reclaim the $90,000–$90,500 band, rolled over, and slid through $88,500 before briefly dipping under $87,000. Buyers did show up around $85,000, but the rebound so far looks more like stabilization than a clear trend reversal. Bitcoin dips hard, finds a bid near $85,000(h3) BTC’s latest move lower began when it couldn’t build follow-through above $90,000 and $90,500. Once that upside stalled, sellers took control and pushed price down through $88,500. The slide accelerated enough to spike below $87,000, but the market didn’t free-fall. Bulls defended the $85,000 zone, printing a low at $85,151. Since then, Bitcoin has been consolidating below the 23.6% Fibonacci retracement of the drop from the $93,560 swing high to the $85,151 low — a clue that the bounce is still shallow and that sellers haven’t fully backed off yet. Structurally, BTC is still on the back foot: It’s trading below $88,000, and It remains below the 100-hour Simple Moving Average, keeping short-term trend pressure pointed downward. Resistance is layered, and $89,000 is the problem area(h3) If bulls try to turn this into a recovery, they’ll have to climb through multiple ceilings in quick succession. First, BTC faces resistance around $87,150, followed by a more meaningful barrier near $87,500. From there, the market’s attention snaps back to $88,000 — the level BTC just lost and now needs to reclaim. A close back above $88,000 would improve the tone, but it doesn’t solve the bigger issue: there’s a bearish trend line on the hourly BTC/USD chart (Kraken feed) with resistance near $89,000, which also lines up with the next technical hurdle. If BTC can push through $89,000 and hold, the rebound could extend toward $90,000, with follow-through targets at $91,000 and $91,500. But until price clears that $88,000–$89,000 zone, rallies are at risk of being sold rather than chased. If BTC fails to reclaim resistance, the downside path is clear(h3) The near-term bear case is simple: if Bitcoin can’t climb back above the $87,000 area and keep traction, sellers may attempt another leg lower. Support levels line up like this: Immediate support: $85,500 First major support: $85,000 Next support: $83,500 Then $82,500 in the near term Below that, the major “don’t break this” level is still $80,000. If BTC slips under $80,000, the risk of acceleration to the downside increases significantly — not because it’s magic, but because it’s the kind of psychological and structural level that tends to trigger forced de-risking. Indicators: momentum still leans bearish(h3) The intraday indicators aren’t offering much comfort yet: Hourly MACD is losing pace in the bearish zone. Hourly RSI remains below 50, suggesting sellers still have the upper hand on short timeframes. So while the $85,000 defense held for now, the market hasn’t flipped bullish — it’s just stopped bleeding.
Author  Mitrade
Yesterday 02: 56
Bitcoin has dropped back below $88,000 after rolling over from $90,500, with price still trading under the 100-hour Simple Moving Average. The sell-off found a floor at $85,151, and BTC is now consolidating near that base, but rebounds are facing pressure from a bearish trend line around $89,000. Bulls need to retake $88,000–$89,000 to ease downside risk; failure to do so keeps $85,500–$85,000 and then $83,500 in play, with $80,000 as the deeper “line in the sand.” Bitcoin (BTC) is back in damage-control mode after a sharp pullback wiped out recent gains. The price failed to reclaim the $90,000–$90,500 band, rolled over, and slid through $88,500 before briefly dipping under $87,000. Buyers did show up around $85,000, but the rebound so far looks more like stabilization than a clear trend reversal. Bitcoin dips hard, finds a bid near $85,000(h3) BTC’s latest move lower began when it couldn’t build follow-through above $90,000 and $90,500. Once that upside stalled, sellers took control and pushed price down through $88,500. The slide accelerated enough to spike below $87,000, but the market didn’t free-fall. Bulls defended the $85,000 zone, printing a low at $85,151. Since then, Bitcoin has been consolidating below the 23.6% Fibonacci retracement of the drop from the $93,560 swing high to the $85,151 low — a clue that the bounce is still shallow and that sellers haven’t fully backed off yet. Structurally, BTC is still on the back foot: It’s trading below $88,000, and It remains below the 100-hour Simple Moving Average, keeping short-term trend pressure pointed downward. Resistance is layered, and $89,000 is the problem area(h3) If bulls try to turn this into a recovery, they’ll have to climb through multiple ceilings in quick succession. First, BTC faces resistance around $87,150, followed by a more meaningful barrier near $87,500. From there, the market’s attention snaps back to $88,000 — the level BTC just lost and now needs to reclaim. A close back above $88,000 would improve the tone, but it doesn’t solve the bigger issue: there’s a bearish trend line on the hourly BTC/USD chart (Kraken feed) with resistance near $89,000, which also lines up with the next technical hurdle. If BTC can push through $89,000 and hold, the rebound could extend toward $90,000, with follow-through targets at $91,000 and $91,500. But until price clears that $88,000–$89,000 zone, rallies are at risk of being sold rather than chased. If BTC fails to reclaim resistance, the downside path is clear(h3) The near-term bear case is simple: if Bitcoin can’t climb back above the $87,000 area and keep traction, sellers may attempt another leg lower. Support levels line up like this: Immediate support: $85,500 First major support: $85,000 Next support: $83,500 Then $82,500 in the near term Below that, the major “don’t break this” level is still $80,000. If BTC slips under $80,000, the risk of acceleration to the downside increases significantly — not because it’s magic, but because it’s the kind of psychological and structural level that tends to trigger forced de-risking. Indicators: momentum still leans bearish(h3) The intraday indicators aren’t offering much comfort yet: Hourly MACD is losing pace in the bearish zone. Hourly RSI remains below 50, suggesting sellers still have the upper hand on short timeframes. So while the $85,000 defense held for now, the market hasn’t flipped bullish — it’s just stopped bleeding.
placeholder
Senate Delays Crypto Market Structure Hearings to Early 2026The Senate Banking Committee has postponed cryptocurrency market structure hearings until 2026, citing ongoing bipartisan negotiations.
Author  Mitrade
23 hours ago
The Senate Banking Committee has postponed cryptocurrency market structure hearings until 2026, citing ongoing bipartisan negotiations.
goTop
quote