

NZD/USD Price Forecasts: First signs of exhaustion below 0.5600
- The New Zealand Dollar treads water near the 0.5600 line against the USD on Monday.
- Hopes of an RBNZ cut on Wednesday are weighing on the Kiwi.
- Technical indicators suggest that the bearish trend night be losing momentum.
The New Zealand Dollar is struggling to find acceptance above 0.5600 on Monday, after bouncing from multi-month lows at 0.5570. The pair maintains its broader bearish trend intact, amid hopes of further RBNZ easing later this week. Still, the technical picture seems to be giving the first signs of exhaustion after having depreciated about 9% in less than four months.
The pair, however, is unlikely to post any significant recovery ahead of New Zealand’s central bank decision, due on Wednesday. The market has priced in a quarter-point rate cut, and the focus will be on the monetary policy statement to assess the chances of further easing next year.
Technical Analysis: Potential end wedge pattern in the daily chart
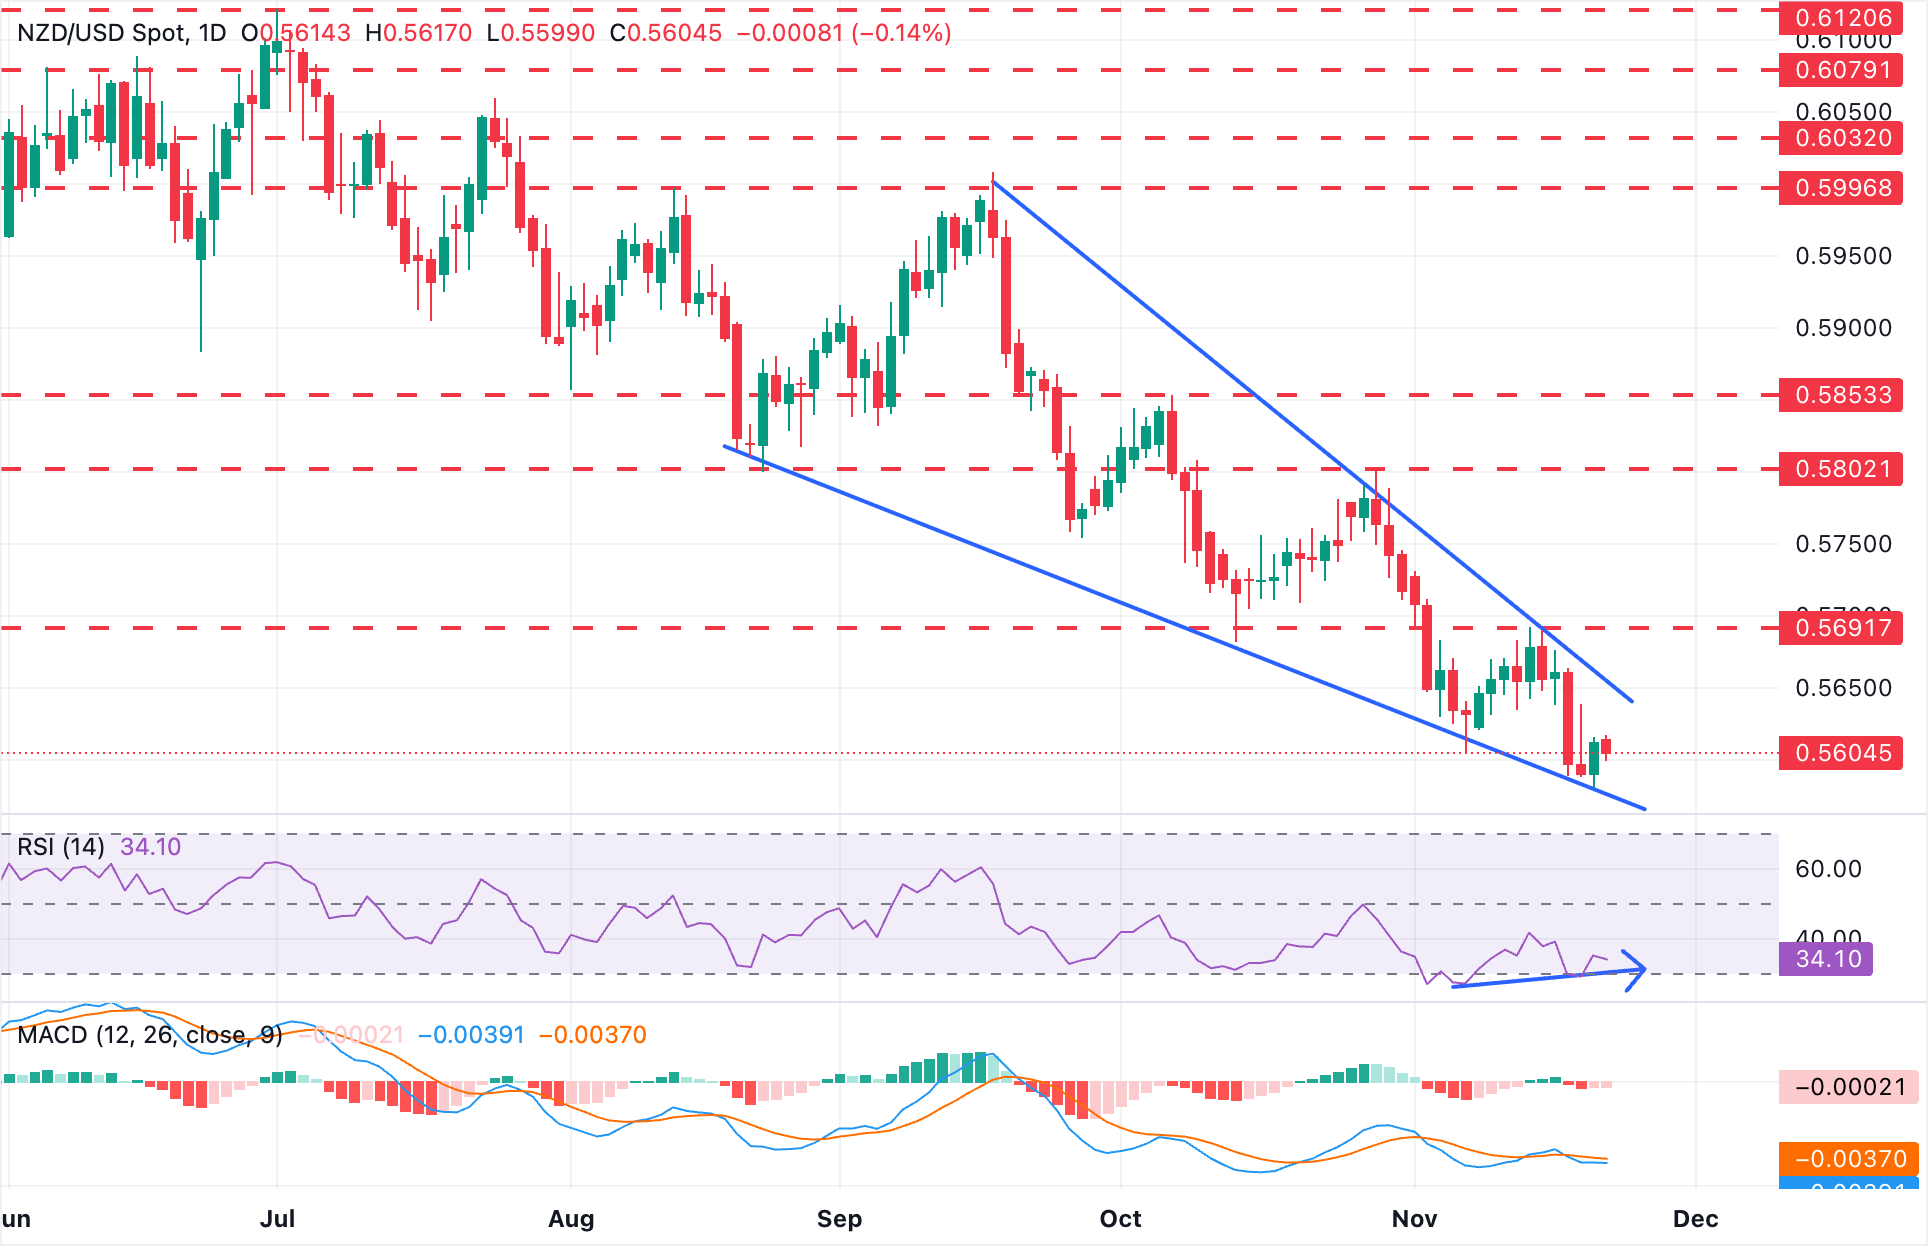
A look at the daily chart shows an ending wedge pattern, a figure often seen at the end of trading cycles, suggesting that the balance of forces between bulls and bears is rebalancing, in this case, suggesting that the bearish momentum might be losing steam.
With that in mind, the pair is not giving clear signs to confirm a trend shift, although the bullish divergence in the daily Relative Strength Index should act as a warning for sellers. The Moving Average Convergence Divergence (MACD) remains marginally below zero, although it is turning flat, which suggests that bearish momentum is weak.
The descending trend line from the 0.6000 area continues to cap rebounds, with resistance seen around 0.5649. Immediate hurdles emerge at the November 14 and 17 highs near 0.5690 and the 0.5800 area (October 28 highs. Failure to reclaim these barriers would preserve the bearish bias.
Immediate support is at Friday´s low of 0.5580 and the wedge bottom, now around 0.5575. Further down, the 0.5500 psychological level, and April's low of 0.5485 would come into focus.
(The technical analysis of this story was written with the help of an AI tool).
RBNZ FAQs
The Reserve Bank of New Zealand (RBNZ) is the country’s central bank. Its economic objectives are achieving and maintaining price stability – achieved when inflation, measured by the Consumer Price Index (CPI), falls within the band of between 1% and 3% – and supporting maximum sustainable employment.
The Reserve Bank of New Zealand’s (RBNZ) Monetary Policy Committee (MPC) decides the appropriate level of the Official Cash Rate (OCR) according to its objectives. When inflation is above target, the bank will attempt to tame it by raising its key OCR, making it more expensive for households and businesses to borrow money and thus cooling the economy. Higher interest rates are generally positive for the New Zealand Dollar (NZD) as they lead to higher yields, making the country a more attractive place for investors. On the contrary, lower interest rates tend to weaken NZD.
Employment is important for the Reserve Bank of New Zealand (RBNZ) because a tight labor market can fuel inflation. The RBNZ’s goal of “maximum sustainable employment” is defined as the highest use of labor resources that can be sustained over time without creating an acceleration in inflation. “When employment is at its maximum sustainable level, there will be low and stable inflation. However, if employment is above the maximum sustainable level for too long, it will eventually cause prices to rise more and more quickly, requiring the MPC to raise interest rates to keep inflation under control,” the bank says.
In extreme situations, the Reserve Bank of New Zealand (RBNZ) can enact a monetary policy tool called Quantitative Easing. QE is the process by which the RBNZ prints local currency and uses it to buy assets – usually government or corporate bonds – from banks and other financial institutions with the aim to increase the domestic money supply and spur economic activity. QE usually results in a weaker New Zealand Dollar (NZD). QE is a last resort when simply lowering interest rates is unlikely to achieve the objectives of the central bank. The RBNZ used it during the Covid-19 pandemic.
Recommended Articles


