

GBP/USD steadies after sharp drop as Reeves’ tax warning sparks fiscal jitters
- GBP/USD trims losses triggered by UK finance chief Rachel Reeves signaling tax hikes to meet fiscal goals.
- BoE expected to hold rates, though soft inflation keeps December rate-cut bets alive.
- Strong US ISM Services and upbeat ADP jobs data trim odds of a December Fed cut to around 64%.
The GBP/USD holds firm on Wednesday following Tuesday’s 0.90% losses due to UK’s finance minister Rachel Reeves saying that she could raise taxes to meet her fiscal rules. The pair trades at 1.3028 virtually unchanged.
Sterling stabilizes near 1.3030 amid cautious mood and resilient US data
On Tuesday, Reeves crossed the wires, saying that the UK is facing challenges since her first budget, amid growing questions about which taxes she would raise to keep her budget on track.
Analysts at Societe Generale said, “She is justifying tough decisions to come in the budget. The fact that this is happening at all means that manifesto pledges will not be followed to the letter.”
Meanwhile, the Bank of England is expected to keep rates unchanged, although the latest inflation prints missed estimates on the downside, increasing the chances that the BoE could lower borrowing costs by the end of the year.
ISM Services expand and jobs market remains healthy in the US
Across the pond, the ISM Services PMI showed that business activity picked up in October, with the Index rising to 52.4, up from 50.0 in September. Although business activity improved, the Prices Paid subcomponent rose to its highest level at 70, for the first time since October 2022, an indication of inflationary pressures.
Earlier, the ADP National Employment Change revealed that non-farm jobs exceeded estimates of 28K, increased by 42K in October, up from September downward revised -29K.
Following the last tranche of US economic data, market players trimmed the chances for a 25-basis point rate cut by the Fed, at the upcoming December meeting, with odds down to 64% to 68% pre-release of the ADP report.
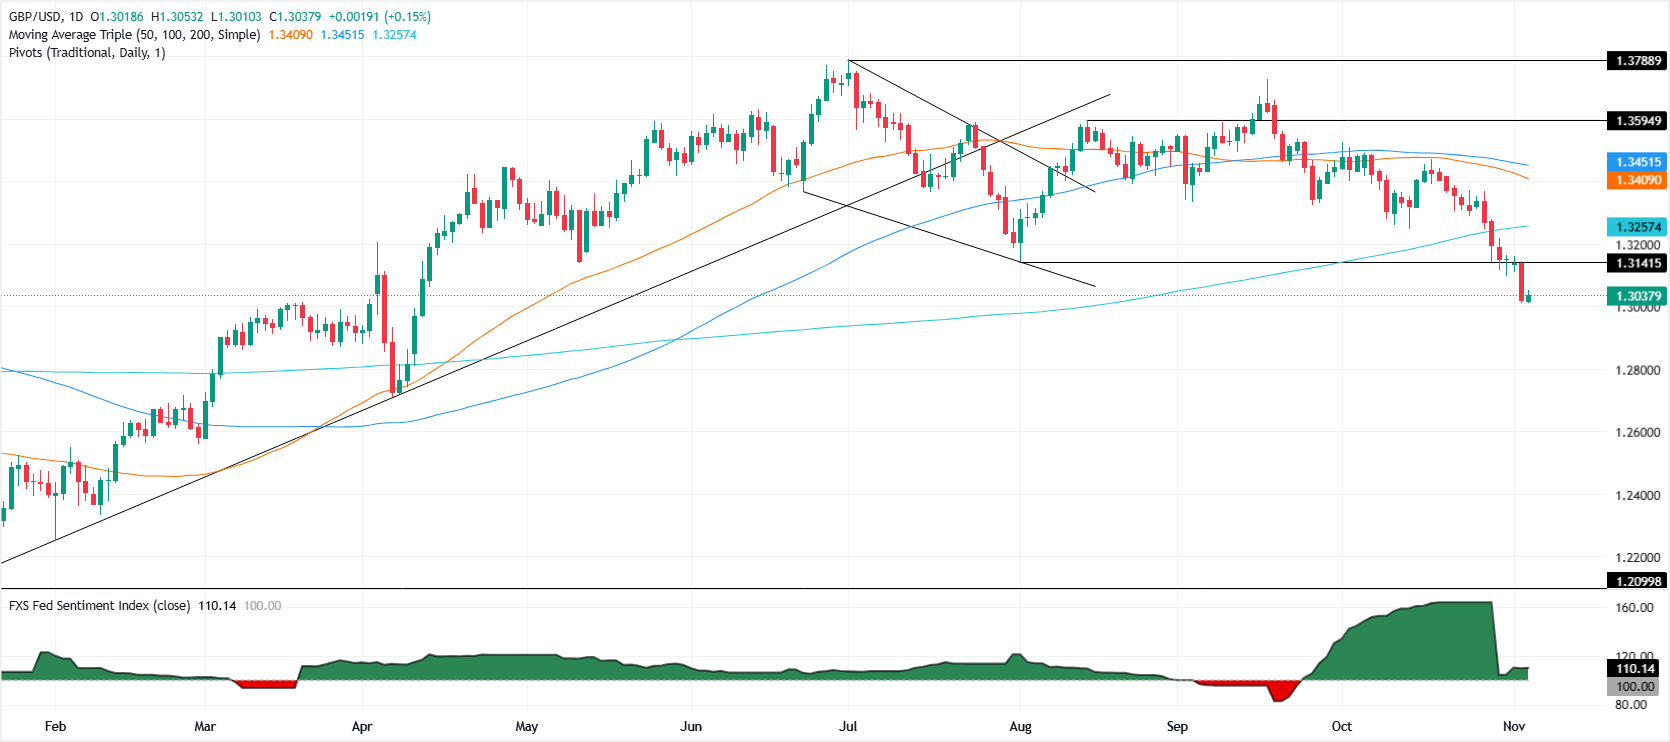
GBP/USD Price Forecast: Technical outlook
Further downside is expected, as the GBP/USD cleared the 200-day Simple Moving Average (SMA) At 1.3254 five days ago. A breach of the 1.3000 figure will expose the April 8 swing low of 1.2708.
Conversely, if GBP/USD clears 1.3100, this opens the door to re-test the current week’s high if 1.3139.
Pound Sterling Price This week
The table below shows the percentage change of British Pound (GBP) against listed major currencies this week. British Pound was the strongest against the New Zealand Dollar.
| USD | EUR | GBP | JPY | CAD | AUD | NZD | CHF | |
|---|---|---|---|---|---|---|---|---|
| USD | 0.47% | 0.73% | 0.15% | 0.81% | 0.81% | 1.38% | 0.76% | |
| EUR | -0.47% | 0.26% | -0.27% | 0.34% | 0.32% | 0.90% | 0.29% | |
| GBP | -0.73% | -0.26% | -0.66% | 0.08% | 0.06% | 0.64% | 0.03% | |
| JPY | -0.15% | 0.27% | 0.66% | 0.63% | 0.63% | 1.20% | 0.73% | |
| CAD | -0.81% | -0.34% | -0.08% | -0.63% | -0.07% | 0.54% | -0.03% | |
| AUD | -0.81% | -0.32% | -0.06% | -0.63% | 0.07% | 0.59% | -0.03% | |
| NZD | -1.38% | -0.90% | -0.64% | -1.20% | -0.54% | -0.59% | -0.61% | |
| CHF | -0.76% | -0.29% | -0.03% | -0.73% | 0.03% | 0.03% | 0.61% |
The heat map shows percentage changes of major currencies against each other. The base currency is picked from the left column, while the quote currency is picked from the top row. For example, if you pick the British Pound from the left column and move along the horizontal line to the US Dollar, the percentage change displayed in the box will represent GBP (base)/USD (quote).
Recommended Articles


