
AUD/USD Price Forecast: Aussie holds firm above key support despite Greenback’s strength
- Australian Dollar edges lower below 0.6600 as renewed Greenback strength keeps sellers in control.
- Short-term bias leans mildly bearish as the pair struggles below the 21-day SMA at 0.6609.
- Initial support rests at 0.6580, followed by the 50-day SMA and the 100-day SMA.
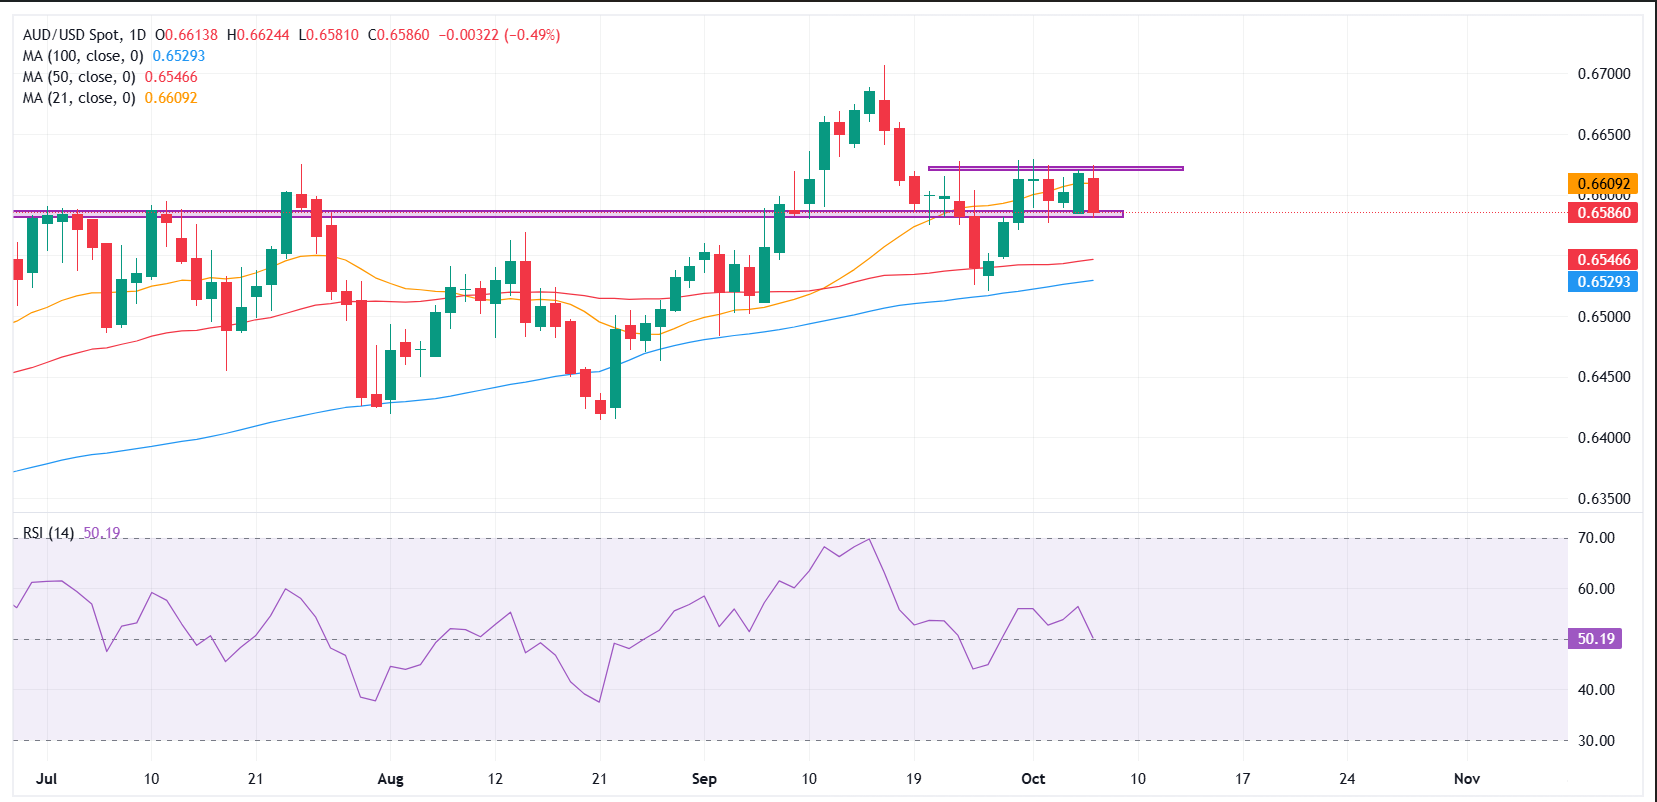
The Australian Dollar (AUD) edges lower against the US Dollar (USD) on Tuesday as renewed Greenback strength keeps the pair on the defensive. At the time of writing, AUD/USD is hovering near 0.6585, slipping below the 0.6600 psychological mark and trading within the narrow 0.6580-0.6620 band that has contained price action since last week.
The near-term bias remains slightly bearish as the pair struggles beneath the 21-day Simple Moving Average (SMA) at 0.6609. A sustained break under 0.6580 would expose the 50-day SMA at 0.6547, with further downside risk toward the 100-day SMA at 0.6529. These levels are likely to act as near-term supports and could attract dip-buyers if risk sentiment stabilizes.
On the upside, the 0.6620-0.6630 area emerges as the first resistance zone, coinciding with recent daily highs and the upper boundary of the consolidation channel.
A decisive break above this barrier could open the way for a retest of the September peak near 0.6707. However, the lack of strong bullish momentum suggests that any rebound might remain capped unless broader USD weakness or fresh economic data spark renewed buying interest.
The Relative Strength Index (RSI) on the daily chart is hovering near 51, indicating neither overbought nor oversold conditions. While the US Dollar’s recent strength could prove short-lived amid the prolonged United States (US) government shutdown and rising expectations of further interest rate cuts by the Federal Reserve (Fed), any pullback in the Greenback is likely to keep downside in AUD/USD contained. At the same time, the Reserve Bank of Australia's (RBA) cautious stance on further monetary policy easing provides an additional layer of support.
Australian Dollar Price Today
The table below shows the percentage change of Australian Dollar (AUD) against listed major currencies today. Australian Dollar was the strongest against the Japanese Yen.
| USD | EUR | GBP | JPY | CAD | AUD | NZD | CHF | |
|---|---|---|---|---|---|---|---|---|
| USD | 0.42% | 0.35% | 0.96% | 0.05% | 0.43% | 0.72% | 0.24% | |
| EUR | -0.42% | -0.06% | 0.55% | -0.36% | 0.04% | 0.31% | -0.05% | |
| GBP | -0.35% | 0.06% | 0.61% | -0.30% | 0.15% | 0.34% | 0.01% | |
| JPY | -0.96% | -0.55% | -0.61% | -0.88% | -0.48% | -0.31% | -0.72% | |
| CAD | -0.05% | 0.36% | 0.30% | 0.88% | 0.37% | 0.63% | 0.31% | |
| AUD | -0.43% | -0.04% | -0.15% | 0.48% | -0.37% | 0.13% | -0.13% | |
| NZD | -0.72% | -0.31% | -0.34% | 0.31% | -0.63% | -0.13% | -0.41% | |
| CHF | -0.24% | 0.05% | -0.01% | 0.72% | -0.31% | 0.13% | 0.41% |
The heat map shows percentage changes of major currencies against each other. The base currency is picked from the left column, while the quote currency is picked from the top row. For example, if you pick the Australian Dollar from the left column and move along the horizontal line to the US Dollar, the percentage change displayed in the box will represent AUD (base)/USD (quote).
Recommended Articles


