
EUR/GBP Price Forecast: Upside attempts are limited below 0.8700
- Euro recovery attempts have been capped at 0.8700, and the pair retreated to 0.8685 again.
- The Euro remains on the defensive amid France's political crisis.
- EUR/GBP has a key support in the 0.8660-0.8670 area.
The Euro has given away previous gains and is trading practically flat on the daily chart against the British Pound. The pair consolidates Monday’s losses near 0.8685 after its recovery attempt from Monday’s lows, at 0.8675, was rejected in the 0.8700 area.
The Euro remains on the defensive, with all eyes in France, where the unexpected resignation of Prime Minister Lecorny has boosted concerns about the country’s fragile fiscal stability, and rating agencies have warned of further downgrades.
On the other hand, the Pound is not faring better. Data released last week showed a significant slowdown in services activity, and a survey by the Bank of England released on Tuesday, which reported that hiring plans from British businesses have declined to their weakest levels since 2020
Technical analysis: Looking for direction above the 0.8660 support area
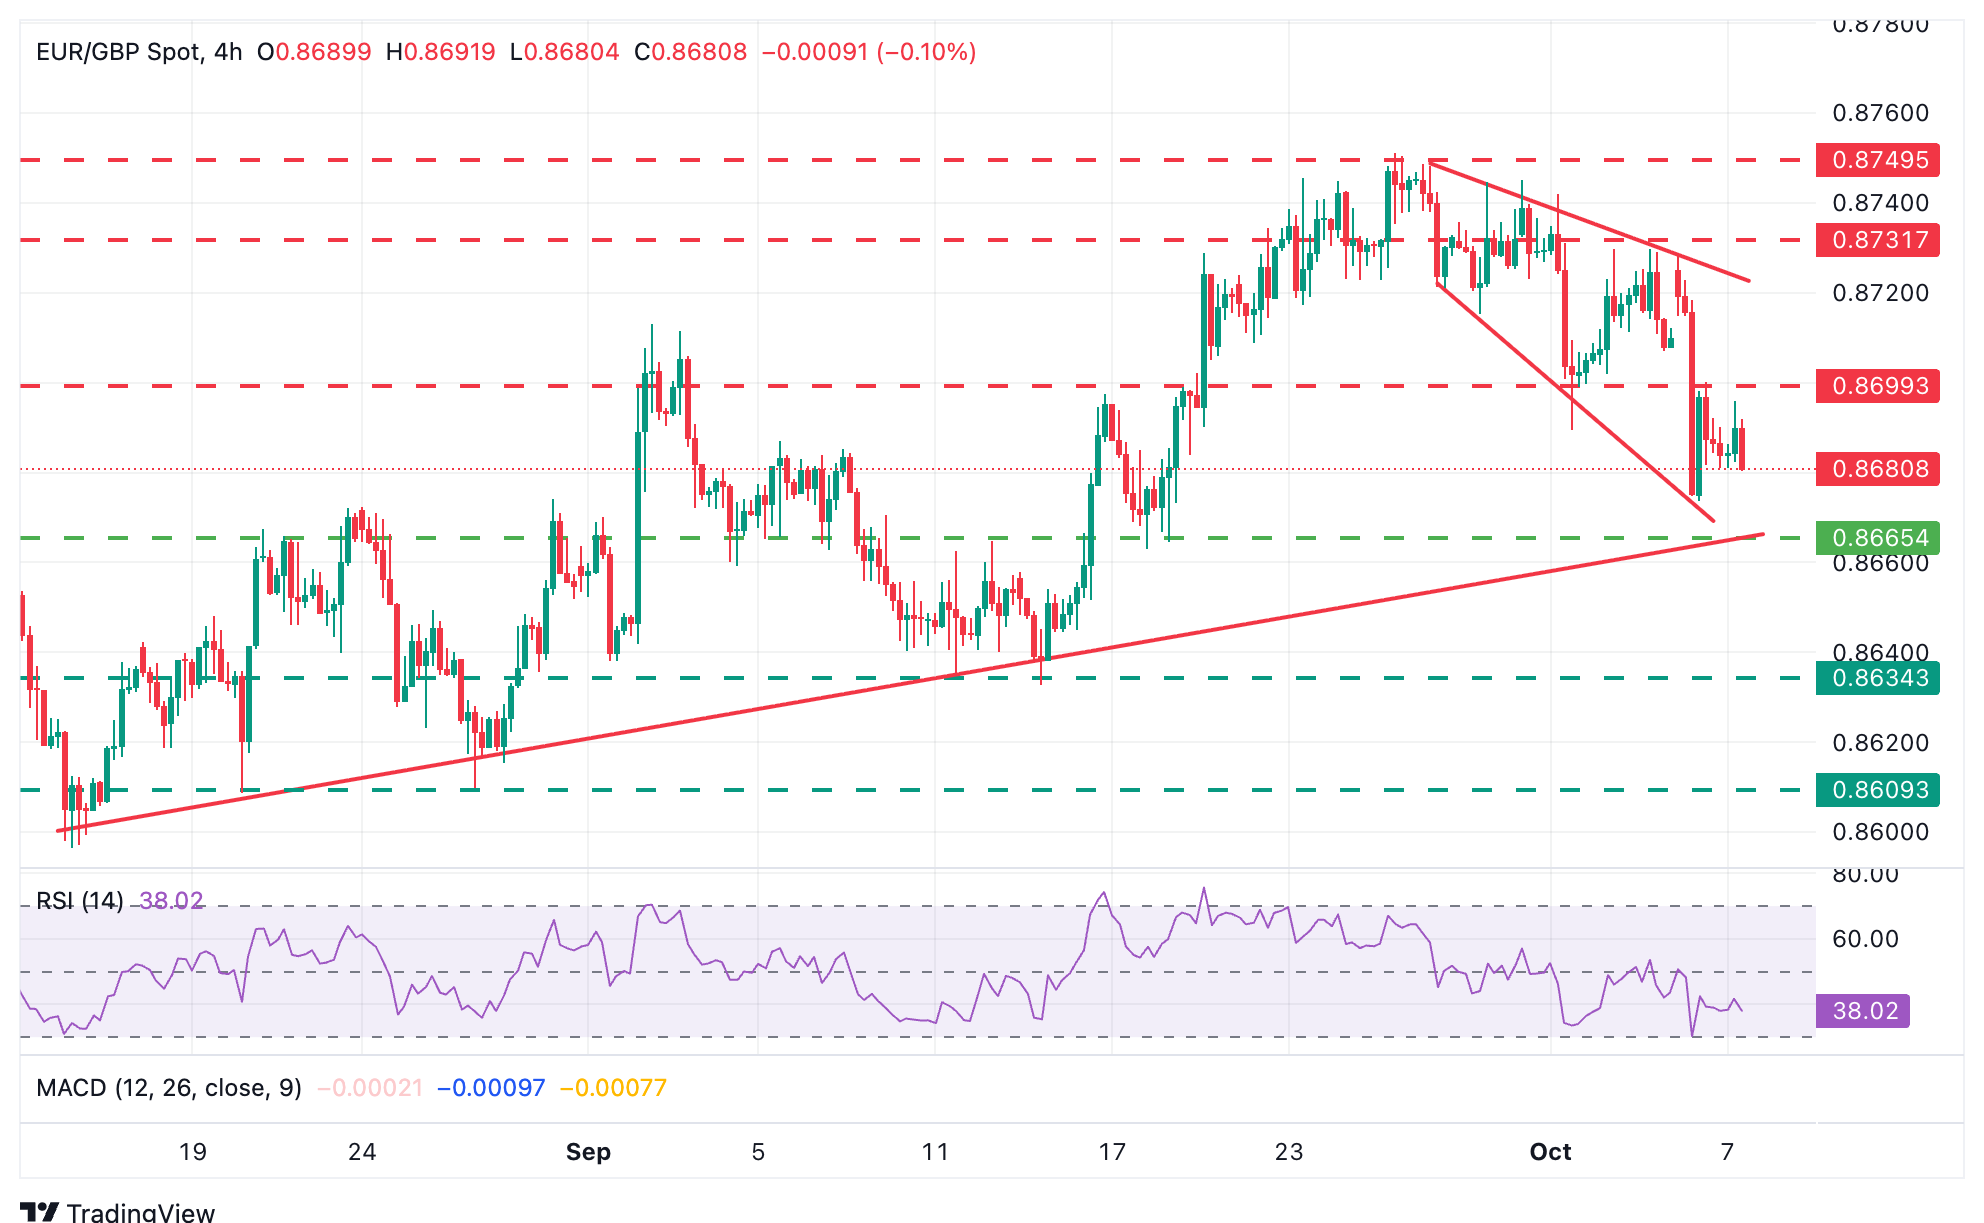
The technical picture shows the pair trading within a broadening wedge, with momentum indicators highlighting a bearish trend. This pattern is often seen near major tops and suggests a negative outcome.
Bears, however, are likely to struggle to extend beyond the 0.8860-0.8670 area, where the confluence of the wedge top with a longer-term trendline support and September 17 lows is expected to provide significant support. Further down, the September 11 and 15 lows, at 0.8630, and the August 20 and 27 lows, at 0.8605, will come into focus.
To the upside, immediate resistance is at the intra-day high of 0.8700, which is closing the path towards the wedge top, at 0.8725, and the October 2 and 3 lows in the 0.8730 area.
Euro Price Today
The table below shows the percentage change of Euro (EUR) against listed major currencies today. Euro was the strongest against the New Zealand Dollar.
| USD | EUR | GBP | JPY | CAD | AUD | NZD | CHF | |
|---|---|---|---|---|---|---|---|---|
| USD | 0.44% | 0.38% | 0.32% | 0.11% | 0.38% | 0.60% | 0.28% | |
| EUR | -0.44% | -0.05% | -0.09% | -0.32% | -0.03% | 0.16% | -0.03% | |
| GBP | -0.38% | 0.05% | -0.06% | -0.28% | 0.06% | 0.17% | 0.02% | |
| JPY | -0.32% | 0.09% | 0.06% | -0.20% | 0.10% | 0.19% | -0.06% | |
| CAD | -0.11% | 0.32% | 0.28% | 0.20% | 0.26% | 0.45% | 0.29% | |
| AUD | -0.38% | 0.03% | -0.06% | -0.10% | -0.26% | 0.05% | -0.04% | |
| NZD | -0.60% | -0.16% | -0.17% | -0.19% | -0.45% | -0.05% | -0.24% | |
| CHF | -0.28% | 0.03% | -0.02% | 0.06% | -0.29% | 0.04% | 0.24% |
The heat map shows percentage changes of major currencies against each other. The base currency is picked from the left column, while the quote currency is picked from the top row. For example, if you pick the Euro from the left column and move along the horizontal line to the US Dollar, the percentage change displayed in the box will represent EUR (base)/USD (quote).
Recommended Articles


