

USD/CHF Price Forecast: Trades sideways around 0.8050 ahead of US PPI data
- USD/CHF oscillates around 0.8050 ahead of the USPI data for July.
- The US PPI report is expected to show that producer inflation grew at a faster pace.
- Investors expect the Fed to cut interest rates in the September meeting.
The USD/CHF pair consolidates in a tight range around 0.8050 during the European trading session on Thursday. The Swiss Franc pair wobbles ahead of the release of the United States (US) Producer Price Index (PPI) data for July, which will be published at 12:30 GMT.
Economists expect the US producer inflation to have grown at a faster pace on a monthly as well as an annual basis. Month-on-month headline and core PPI are estimated to have risen by 0.2%, after remaining flat in June.
Ahead of the US PPI data, the US Dollar Index (DXY), which tracks the Greenback’s value against six major currencies, trades with caution near the two-week low of around 97.60.
The US Dollar has been underperforming as cooling labor market conditions, and a nominal impact of tariffs on inflation have fuelled expectations supporting interest rate cuts by the Federal Reserve (Fed) for the September meeting.
In the Swiss region, price pressures undershooting the Swiss National Bank’s (SNB) inflation target below 2% have increased hopes of interest rates falling into the negative territory.
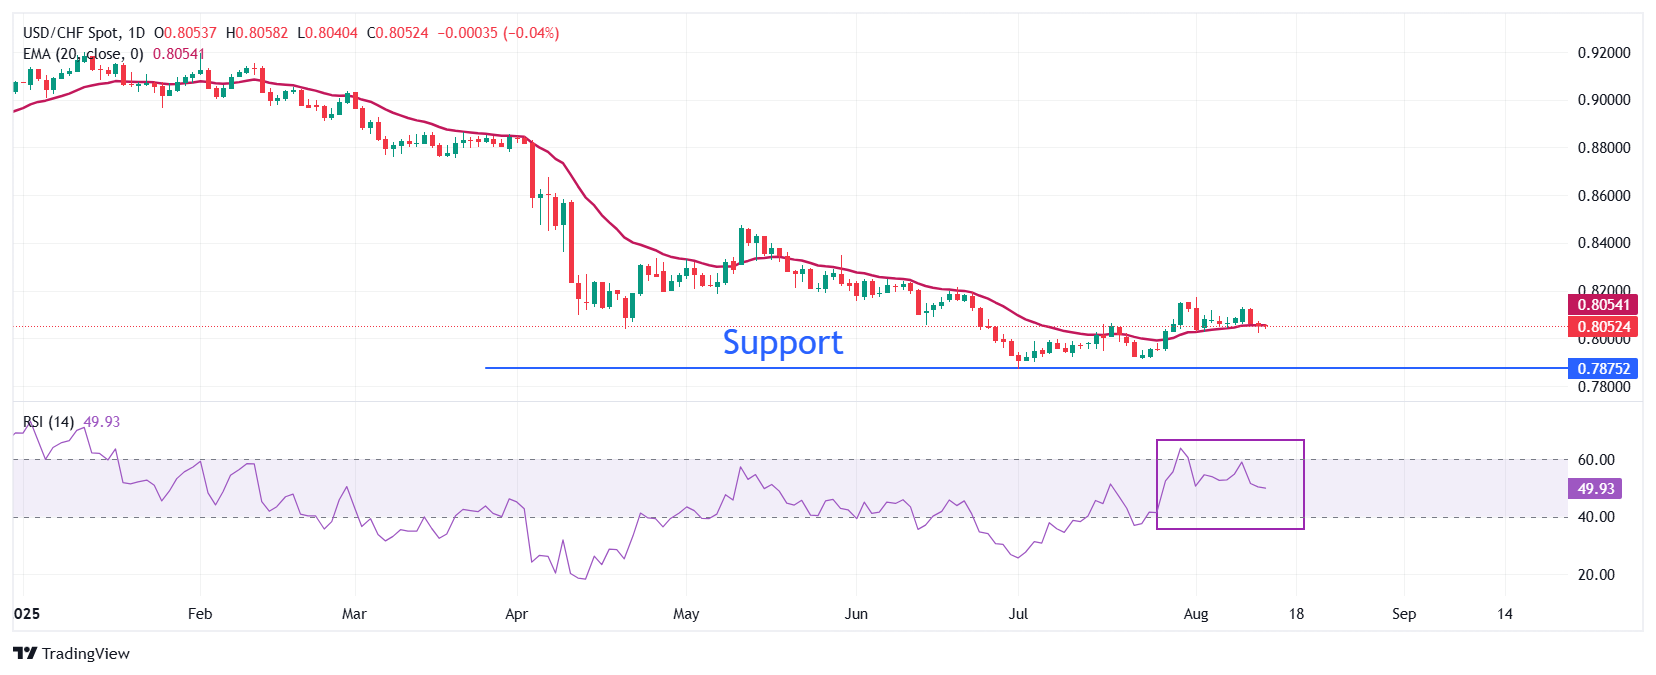
USD/CHF trades in a limited range near the 20-day Exponential Moving Average (EMA) around 0.8054, indicating a sideways trend.
The 14-day Relative Strength Index (RSI) wobbles inside the 40.00-60.00 range, suggesting a sharp volatility contraction.
The pair could witness a fresh downside move towards the 0.7850 support level, and the round-level cushion of 0.7800, if it breaks below the July 1 low of 0.7872.
In an alternate scenario, a recovery move by the pair above the August 1 high of 0.8170 will open the room for more upside towards the June 19 high of 0.8215, followed by the June 6 high of 0.8248.
USD/CHF daily chart
US Dollar FAQs
The US Dollar (USD) is the official currency of the United States of America, and the ‘de facto’ currency of a significant number of other countries where it is found in circulation alongside local notes. It is the most heavily traded currency in the world, accounting for over 88% of all global foreign exchange turnover, or an average of $6.6 trillion in transactions per day, according to data from 2022. Following the second world war, the USD took over from the British Pound as the world’s reserve currency. For most of its history, the US Dollar was backed by Gold, until the Bretton Woods Agreement in 1971 when the Gold Standard went away.
The most important single factor impacting on the value of the US Dollar is monetary policy, which is shaped by the Federal Reserve (Fed). The Fed has two mandates: to achieve price stability (control inflation) and foster full employment. Its primary tool to achieve these two goals is by adjusting interest rates. When prices are rising too quickly and inflation is above the Fed’s 2% target, the Fed will raise rates, which helps the USD value. When inflation falls below 2% or the Unemployment Rate is too high, the Fed may lower interest rates, which weighs on the Greenback.
In extreme situations, the Federal Reserve can also print more Dollars and enact quantitative easing (QE). QE is the process by which the Fed substantially increases the flow of credit in a stuck financial system. It is a non-standard policy measure used when credit has dried up because banks will not lend to each other (out of the fear of counterparty default). It is a last resort when simply lowering interest rates is unlikely to achieve the necessary result. It was the Fed’s weapon of choice to combat the credit crunch that occurred during the Great Financial Crisis in 2008. It involves the Fed printing more Dollars and using them to buy US government bonds predominantly from financial institutions. QE usually leads to a weaker US Dollar.
Quantitative tightening (QT) is the reverse process whereby the Federal Reserve stops buying bonds from financial institutions and does not reinvest the principal from the bonds it holds maturing in new purchases. It is usually positive for the US Dollar.
Recommended Articles


