


Snowflake Inc Stock (SNOW) Moved Down by 3.07% on Oct 29: Facts Behind the Movement
Snowflake Inc (SNOW) moved down by 3.07%. The Software & IT Services sector is down by 5.47%. The company outperformed the industry. Top 3 stocks by turnover in the sector: Alphabet Inc Class A (GOOGL) down 12.53%; Alphabet Inc Class C (GOOG) down 12.35%; Microsoft Corp (MSFT) down 1.33%.
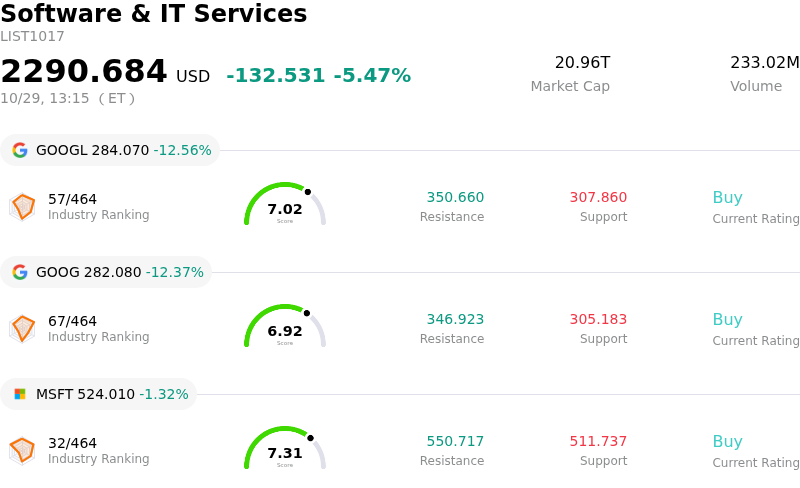
What is driving Snowflake Inc (SNOW)’s stock price down today?
The downward pull on Snowflake Inc. was primarily driven by a broader sell-off across the enterprise software and technology sector. Disappointing forward guidance and growth metrics from key enterprise software and cybersecurity peers triggered renewed market anxieties regarding high valuation multiples and enterprise software budgets. Concerns over the pace of artificial intelligence monetization and mixed quarterly earnings signals from mega-cap tech leaders generated sector-wide volatility, prompting institutional investors to temporarily trim exposure to high-growth cloud software equities.
Snowflake's premium valuation multiple leaves the equity particularly sensitive to broader software sector rotations and profit-taking. Having recently staged a significant multi-month rally driven by solid quarterly revenue beats and upgraded revenue guidance, the stock faced intraday selling pressure as market participants rebalanced portfolios away from higher-multiple cloud platforms. The heightened intraday volatility reflects a broader market recalibration of cloud enterprise software multiples amid rising caution surrounding future spending trajectories and contract renewals.
Despite the short-term headwinds from macroeconomic and sector-wide sentiment, Snowflake's underlying operational narrative remains supported by accelerating enterprise adoption of cloud data analytics and artificial intelligence tools. Strategic initiatives to expand native cloud infrastructure partnerships continue to lower integration friction for enterprise clients, reinforcing long-term platform consumption potential. However, until broader software market sentiment stabilizes, near-term share price performance will likely remain tightly linked to macro risk appetite and overall technology sector earnings trends.
Technical Analysis of Snowflake Inc (SNOW)
Technically, Snowflake Inc (SNOW) shows a MACD (12,26,9) value of -0.165, indicating a sell signal. The RSI at 48.708 suggests neutral condition and the Williams %R at 60.416 suggests sell condition. Please monitor closely.
Fundamental Analysis of Snowflake Inc (SNOW)
Snowflake Inc (SNOW) is in the Software & IT Services industry. Its latest annual revenue is $4.68B, ranking 69 in the industry. The net profit is $-1.33B, ranking 605 in the industry. Company Profile
Over the past month, multiple analysts have rated the company as Buy, with an average price target of $426.71, a high of $525.00, and a low of $110.00.
More details about Snowflake Inc (SNOW)
Company Specific Risks:
- Elevated Valuation and Multiple Contraction Risk: Following a substantial multi-month rally, Snowflake trades at elevated valuation multiples exceeding 21x trailing sales with a negative P/E ratio, leaving the share price highly vulnerable to profit-taking, rising Treasury yield pressures, and severe multiple contraction during software sector pullbacks.
- Persistent GAAP Losses and Stock-Based Compensation Dilution: Despite generating positive non-GAAP free cash flow, Snowflake continues to report significant GAAP net losses exceeding $1.3 billion annually, driven by stock-based compensation expenses that swallow roughly 35% of total revenue and draw persistent scrutiny from fundamental institutional investors.
- Heavy Insider Equity Disposals: SEC filings disclose ongoing insider selling activity among board members and senior executives under Rule 10b5-1 plans—totaling over $400 million in recent quarters—creating overhead technical resistance and stoking investor caution regarding executive sentiment.
- Deceleration in Signed Contract Backlog Growth: While short-term revenue has benefited from AI platform consumption, growth in the company's remaining performance obligations (contract backlog) has moderated to 30% YoY compared to historic rates above 50%, raising institutional concerns over long-term enterprise spending durability and tough multi-year comparisons.
Recommended Articles


